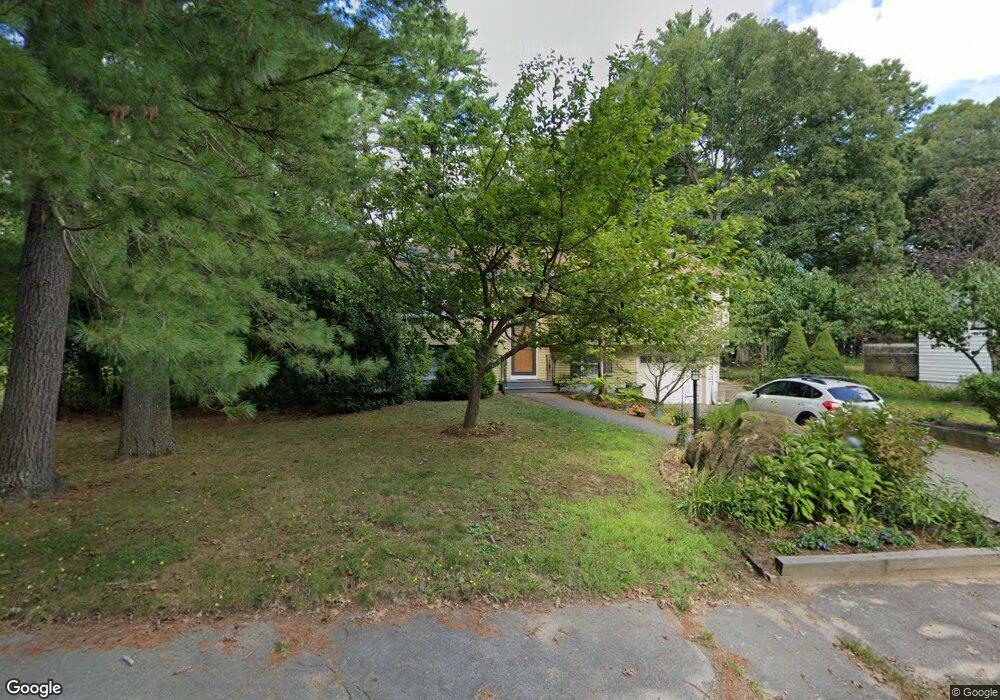
22 Dunbar St Sharon, MA 02067
Estimated Value: $670,000 - $751,000
3
Beds
2
Baths
1,184
Sq Ft
$595/Sq Ft
Est. Value
About This Home
This home is located at 22 Dunbar St, Sharon, MA 02067 and is currently estimated at $704,921, approximately $595 per square foot. 22 Dunbar St is a home located in Norfolk County with nearby schools including Cottage Street Elementary School, Sharon Middle School, and Sharon High School.
Ownership History
Date
Name
Owned For
Owner Type
Purchase Details
Closed on
Jul 1, 2021
Sold by
Pikovsky Anatoly and Pikovsky Larisa
Bought by
Pikovsky Larisa
Current Estimated Value
Purchase Details
Closed on
May 27, 1992
Sold by
Richards Sheryl
Bought by
Pikovsky Anatoly
Create a Home Valuation Report for This Property
The Home Valuation Report is an in-depth analysis detailing your home's value as well as a comparison with similar homes in the area
Home Values in the Area
Average Home Value in this Area
Purchase History
| Date | Buyer | Sale Price | Title Company |
|---|---|---|---|
| Pikovsky Larisa | -- | None Available | |
| Pikovsky Anatoly | $160,000 | -- |
Source: Public Records
Mortgage History
| Date | Status | Borrower | Loan Amount |
|---|---|---|---|
| Previous Owner | Pikovsky Anatoly | $50,000 | |
| Previous Owner | Pikovsky Anatoly | $79,500 | |
| Previous Owner | Pikovsky Anatoly | $141,420 |
Source: Public Records
Tax History Compared to Growth
Tax History
| Year | Tax Paid | Tax Assessment Tax Assessment Total Assessment is a certain percentage of the fair market value that is determined by local assessors to be the total taxable value of land and additions on the property. | Land | Improvement |
|---|---|---|---|---|
| 2025 | $10,764 | $615,800 | $419,100 | $196,700 |
| 2024 | $10,309 | $586,400 | $384,500 | $201,900 |
| 2023 | $10,081 | $542,300 | $359,400 | $182,900 |
| 2022 | $9,646 | $488,400 | $299,500 | $188,900 |
| 2021 | $9,557 | $467,800 | $282,600 | $185,200 |
| 2020 | $9,131 | $480,600 | $295,400 | $185,200 |
| 2019 | $8,449 | $435,300 | $250,100 | $185,200 |
| 2018 | $8,335 | $430,300 | $245,100 | $185,200 |
| 2017 | $8,129 | $414,300 | $229,100 | $185,200 |
| 2016 | $8,000 | $397,800 | $229,100 | $168,700 |
| 2015 | $7,416 | $365,300 | $208,200 | $157,100 |
| 2014 | $6,855 | $333,600 | $189,300 | $144,300 |
Source: Public Records
Map
Nearby Homes