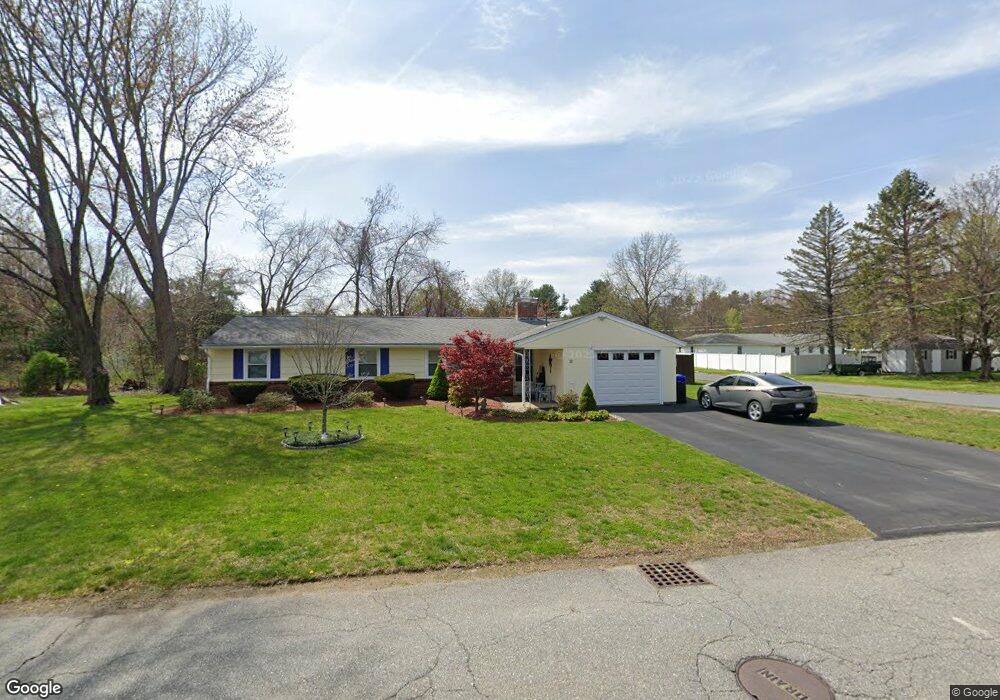
22 Durant Ave Maynard, MA 01754
Estimated Value: $492,000 - $579,691
3
Beds
2
Baths
1,320
Sq Ft
$417/Sq Ft
Est. Value
About This Home
This home is located at 22 Durant Ave, Maynard, MA 01754 and is currently estimated at $549,923, approximately $416 per square foot. 22 Durant Ave is a home located in Middlesex County with nearby schools including Green Meadow School, Fowler School, and Maynard High School.
Ownership History
Date
Name
Owned For
Owner Type
Purchase Details
Closed on
May 5, 2016
Sold by
Fuerst James R and Fuerst Christine P
Bought by
Lindstrom Robert C and Lindstrom Janine C
Current Estimated Value
Home Financials for this Owner
Home Financials are based on the most recent Mortgage that was taken out on this home.
Original Mortgage
$237,500
Outstanding Balance
$18,714
Interest Rate
3.71%
Mortgage Type
New Conventional
Estimated Equity
$531,209
Purchase Details
Closed on
May 17, 2012
Sold by
Fuerst James R and Fuerst Susan A
Bought by
Fuerst James R and Fuerst Christine P
Purchase Details
Closed on
May 19, 2004
Sold by
Tang Rt
Bought by
Fuerst Mary
Create a Home Valuation Report for This Property
The Home Valuation Report is an in-depth analysis detailing your home's value as well as a comparison with similar homes in the area
Home Values in the Area
Average Home Value in this Area
Purchase History
| Date | Buyer | Sale Price | Title Company |
|---|---|---|---|
| Lindstrom Robert C | $250,000 | -- | |
| Fuerst James R | $132,500 | -- | |
| Fuerst Mary | $292,000 | -- |
Source: Public Records
Mortgage History
| Date | Status | Borrower | Loan Amount |
|---|---|---|---|
| Open | Lindstrom Robert C | $237,500 |
Source: Public Records
Tax History Compared to Growth
Tax History
| Year | Tax Paid | Tax Assessment Tax Assessment Total Assessment is a certain percentage of the fair market value that is determined by local assessors to be the total taxable value of land and additions on the property. | Land | Improvement |
|---|---|---|---|---|
| 2025 | $8,027 | $450,200 | $277,800 | $172,400 |
| 2024 | $7,581 | $424,000 | $264,600 | $159,400 |
| 2023 | $7,444 | $392,400 | $252,000 | $140,400 |
| 2022 | $7,069 | $344,500 | $211,600 | $132,900 |
| 2021 | $6,940 | $344,400 | $211,600 | $132,800 |
| 2020 | $6,694 | $324,300 | $191,500 | $132,800 |
| 2019 | $6,607 | $307,200 | $182,900 | $124,300 |
| 2018 | $8,057 | $278,500 | $166,300 | $112,200 |
| 2017 | $4,905 | $278,500 | $166,300 | $112,200 |
| 2016 | $5,918 | $278,500 | $166,300 | $112,200 |
| 2015 | $5,774 | $258,800 | $158,700 | $100,100 |
| 2014 | $5,396 | $242,100 | $153,700 | $88,400 |
Source: Public Records
Map
Nearby Homes
- 6 Durant Ave
- 12 Patti Ln
- 10 Mill St Unit Q
- 10 Mill St Unit B
- 85 Red Acre Rd
- 2 Marble Farm Rd
- 12 Brown St
- 12 Assabet St
- 71 Liberty St
- 7 King St
- 17 Prospect St
- 34 Meeting House Ln Unit 208
- 30 Acton St
- 37 Glendale St
- 2 Wall Ct
- 28 Waltham St Unit A
- 66 Powder Mill Rd
- 68 Powder Mill Rd
- 13 Arthur St Unit 15
- 70 Powder Mill Rd