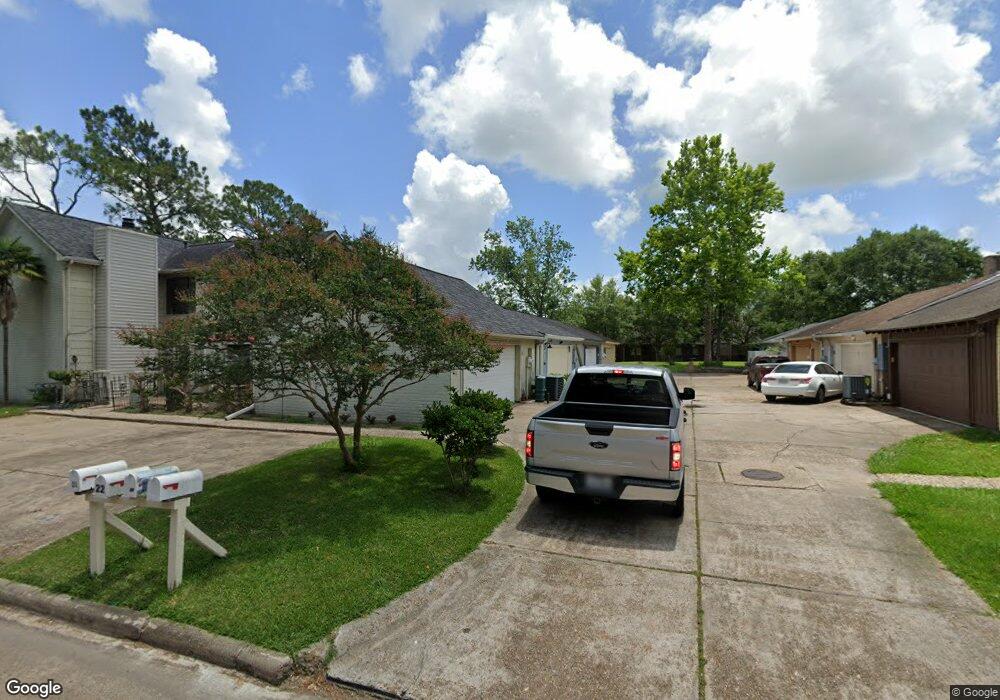
22 E Castle Harbour Dr Friendswood, TX 77546
Estimated Value: $221,000 - $286,512
3
Beds
3
Baths
1,732
Sq Ft
$147/Sq Ft
Est. Value
About This Home
This home is located at 22 E Castle Harbour Dr, Friendswood, TX 77546 and is currently estimated at $254,878, approximately $147 per square foot. 22 E Castle Harbour Dr is a home located in Galveston County with nearby schools including C.W. Cline Elementary School, Windsong Elementary School, and Friendswood Junior High School.
Ownership History
Date
Name
Owned For
Owner Type
Purchase Details
Closed on
Jun 7, 2022
Sold by
Sivley Kristi Lee and Woodcock John Keith
Bought by
Simoneaux Julianna Stibbe and Simoneaux Christopher W
Current Estimated Value
Home Financials for this Owner
Home Financials are based on the most recent Mortgage that was taken out on this home.
Original Mortgage
$190,500
Outstanding Balance
$180,991
Interest Rate
5.1%
Mortgage Type
New Conventional
Estimated Equity
$73,887
Purchase Details
Closed on
Nov 10, 2015
Sold by
Kaabi Lissa Dianne Cook and Cook Lissa Dianne
Bought by
Colbert Tiffany O
Home Financials for this Owner
Home Financials are based on the most recent Mortgage that was taken out on this home.
Original Mortgage
$164,465
Interest Rate
3.9%
Mortgage Type
FHA
Create a Home Valuation Report for This Property
The Home Valuation Report is an in-depth analysis detailing your home's value as well as a comparison with similar homes in the area
Home Values in the Area
Average Home Value in this Area
Purchase History
| Date | Buyer | Sale Price | Title Company |
|---|---|---|---|
| Simoneaux Julianna Stibbe | -- | Chicago Title Company | |
| Colbert Tiffany O | -- | Stewart Title |
Source: Public Records
Mortgage History
| Date | Status | Borrower | Loan Amount |
|---|---|---|---|
| Open | Simoneaux Julianna Stibbe | $190,500 | |
| Previous Owner | Colbert Tiffany O | $164,465 |
Source: Public Records
Tax History Compared to Growth
Tax History
| Year | Tax Paid | Tax Assessment Tax Assessment Total Assessment is a certain percentage of the fair market value that is determined by local assessors to be the total taxable value of land and additions on the property. | Land | Improvement |
|---|---|---|---|---|
| 2025 | $4,541 | $247,630 | $13,450 | $234,180 |
| 2024 | $4,541 | $227,075 | $13,450 | $213,625 |
| 2023 | $4,541 | $234,210 | $13,450 | $220,760 |
| 2022 | $4,474 | $203,111 | $0 | $0 |
| 2021 | $4,313 | $217,360 | $13,450 | $203,910 |
| 2020 | $4,044 | $169,530 | $13,450 | $156,080 |
| 2019 | $3,875 | $152,600 | $11,300 | $141,300 |
| 2018 | $3,941 | $154,290 | $11,300 | $142,990 |
| 2017 | $3,821 | $156,010 | $11,300 | $144,710 |
| 2016 | $3,473 | $133,740 | $11,300 | $122,440 |
| 2015 | $1,349 | $133,740 | $11,300 | $122,440 |
| 2014 | $1,349 | $114,680 | $11,300 | $103,380 |
Source: Public Records
Map
Nearby Homes
- 2512 Ravenna Ct
- 110 Dorado Dr
- Amalfi Plan at Friendswood Trails
- Portofino Plan at Friendswood Trails
- Postiano Plan at Friendswood Trails
- Capri Plan at Friendswood Trails
- Ravello Plan at Friendswood Trails
- 251 Saint Cloud Dr
- 1508 Harvest Vine Ct
- 2829 Fairway Dr
- 2605 S Mission Cir
- 2904 Bridle Path Ln
- 40 Windsong Ln
- 2847 Everett Dr
- 601 E Castle Harbour Dr
- 2871 Love Ln
- 2211 S Mission Cir
- 644 E Castle Harbour Dr
- 1913 Lundy Ln
- 1910 N Mission Cir
- 21 E Castle Harbour Dr
- 23 E Castle Harbour Dr
- 21 E Castle Harbour Dr
- 24 E Castle Harbour Dr
- 25 E Castle Harbour Dr
- 6 E Castle Harbour Dr Unit 26
- 26 E Castle Harbour Dr
- 28 E Castle Harbour Dr
- 7 E Castle Harbour Dr
- 27 E Castle Harbour Dr
- 1521 Sun Meadow Blvd
- 1529 Sun Meadow Blvd
- 220 E Castle Harbour Dr
- 231 E Castle Harbour Dr
- 2500 Ravenna Ct
- 1533 Sun Meadow Blvd
- 224 E Castle Harbour Dr
- 5 Sun Meadow Blvd
- 6 Sun Meadow Blvd
- 5 Sunmeadow Blvd