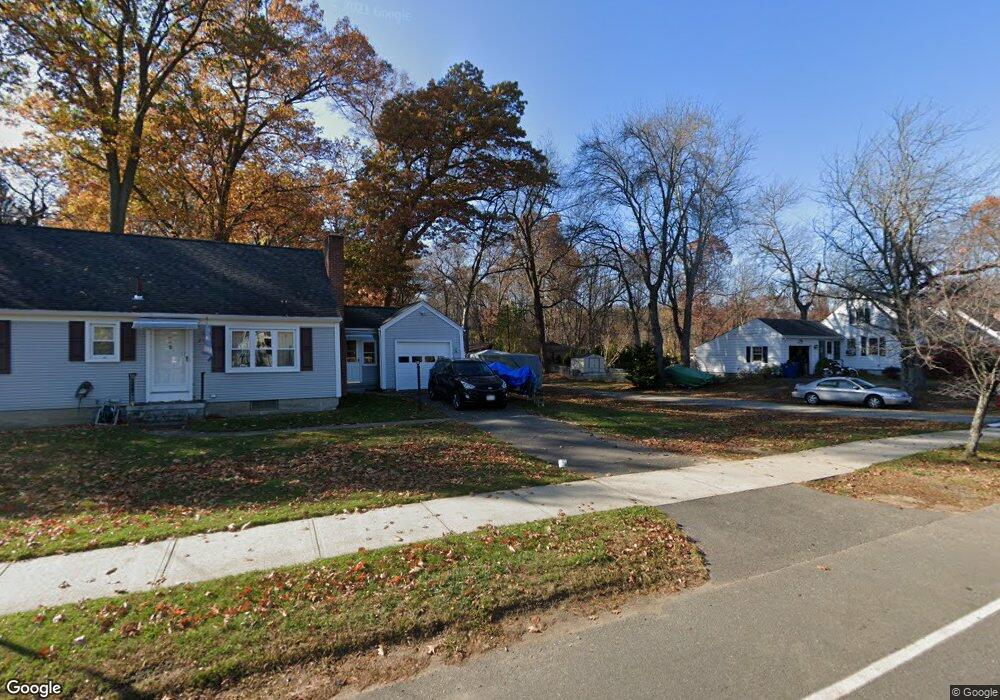
22 E Lincoln St West Springfield, MA 01089
Estimated Value: $424,317 - $582,000
3
Beds
2
Baths
2,640
Sq Ft
$191/Sq Ft
Est. Value
About This Home
This home is located at 22 E Lincoln St, West Springfield, MA 01089 and is currently estimated at $503,579, approximately $190 per square foot. 22 E Lincoln St is a home located in Hampden County with nearby schools including West Springfield High School and St Thomas The Apostle School.
Ownership History
Date
Name
Owned For
Owner Type
Purchase Details
Closed on
Jun 15, 2022
Sold by
Altobelli Eileen
Bought by
Altobelli Michael and Altobelli Rachel A
Current Estimated Value
Purchase Details
Closed on
Apr 17, 2013
Sold by
Thompson Lorraine C
Bought by
Altobelli Aldo
Create a Home Valuation Report for This Property
The Home Valuation Report is an in-depth analysis detailing your home's value as well as a comparison with similar homes in the area
Home Values in the Area
Average Home Value in this Area
Purchase History
| Date | Buyer | Sale Price | Title Company |
|---|---|---|---|
| Altobelli Michael | -- | None Available | |
| Altobelli Michael | -- | None Available | |
| Altobelli Michael | -- | None Available | |
| Altobelli Michael | -- | None Available | |
| Altobelli Aldo | $5,000 | -- |
Source: Public Records
Tax History Compared to Growth
Tax History
| Year | Tax Paid | Tax Assessment Tax Assessment Total Assessment is a certain percentage of the fair market value that is determined by local assessors to be the total taxable value of land and additions on the property. | Land | Improvement |
|---|---|---|---|---|
| 2025 | $5,862 | $394,200 | $115,600 | $278,600 |
| 2024 | $5,826 | $393,400 | $115,600 | $277,800 |
| 2023 | $5,702 | $366,900 | $115,600 | $251,300 |
| 2022 | $5,131 | $325,600 | $105,000 | $220,600 |
| 2021 | $5,082 | $300,700 | $99,500 | $201,200 |
| 2020 | $5,092 | $299,700 | $99,500 | $200,200 |
| 2019 | $5,083 | $299,700 | $99,500 | $200,200 |
| 2018 | $5,110 | $299,700 | $99,500 | $200,200 |
| 2017 | $5,110 | $299,700 | $99,500 | $200,200 |
| 2016 | $5,109 | $300,700 | $95,700 | $205,000 |
| 2015 | $5,009 | $294,800 | $93,800 | $201,000 |
| 2014 | $4,838 | $294,800 | $93,800 | $201,000 |
Source: Public Records
Map
Nearby Homes