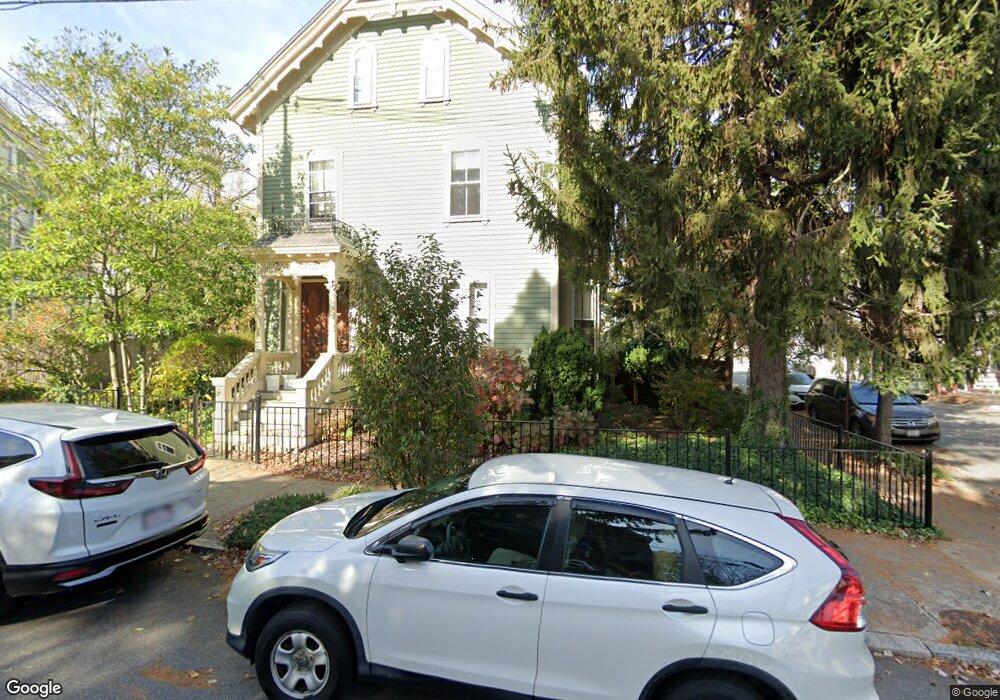
22 E Manning St Providence, RI 02906
Wayland NeighborhoodEstimated Value: $697,000 - $1,218,000
3
Beds
2
Baths
2,742
Sq Ft
$346/Sq Ft
Est. Value
About This Home
This home is located at 22 E Manning St, Providence, RI 02906 and is currently estimated at $949,861, approximately $346 per square foot. 22 E Manning St is a home located in Providence County with nearby schools including Wheeler School, French-American School of Rhode Island, and Moses Brown School.
Ownership History
Date
Name
Owned For
Owner Type
Purchase Details
Closed on
Jun 15, 1998
Sold by
Bolger Doreen
Bought by
Levine Scoh and Bornschein Suzanne
Current Estimated Value
Home Financials for this Owner
Home Financials are based on the most recent Mortgage that was taken out on this home.
Original Mortgage
$204,000
Interest Rate
7.11%
Purchase Details
Closed on
Apr 19, 1994
Sold by
Shapiro Gerald M and Shapiro Nancy
Bought by
Bolger Doreen
Create a Home Valuation Report for This Property
The Home Valuation Report is an in-depth analysis detailing your home's value as well as a comparison with similar homes in the area
Home Values in the Area
Average Home Value in this Area
Purchase History
| Date | Buyer | Sale Price | Title Company |
|---|---|---|---|
| Levine Scoh | $255,000 | -- | |
| Bolger Doreen | $184,000 | -- |
Source: Public Records
Mortgage History
| Date | Status | Borrower | Loan Amount |
|---|---|---|---|
| Open | Bolger Doreen | $300,000 | |
| Closed | Bolger Doreen | $73,662 | |
| Closed | Bolger Doreen | $60,000 | |
| Closed | Bolger Doreen | $204,000 |
Source: Public Records
Tax History
| Year | Tax Paid | Tax Assessment Tax Assessment Total Assessment is a certain percentage of the fair market value that is determined by local assessors to be the total taxable value of land and additions on the property. | Land | Improvement |
|---|---|---|---|---|
| 2025 | $6,593 | $784,900 | $445,500 | $339,400 |
| 2024 | $12,357 | $673,400 | $340,200 | $333,200 |
| 2023 | $12,357 | $673,400 | $340,200 | $333,200 |
| 2022 | $11,987 | $673,400 | $340,200 | $333,200 |
| 2021 | $10,708 | $436,000 | $225,200 | $210,800 |
| 2020 | $10,708 | $436,000 | $225,200 | $210,800 |
| 2019 | $10,708 | $436,000 | $225,200 | $210,800 |
| 2018 | $11,128 | $348,200 | $207,700 | $140,500 |
| 2017 | $11,007 | $344,400 | $207,700 | $136,700 |
| 2016 | $11,007 | $344,400 | $207,700 | $136,700 |
| 2015 | $11,214 | $338,800 | $207,700 | $131,100 |
| 2014 | $11,435 | $338,800 | $207,700 | $131,100 |
| 2013 | $11,435 | $338,800 | $207,700 | $131,100 |
Source: Public Records
Map
Nearby Homes
- 45 E George St
- 14 Amy St
- 18 Amy St
- 355 Angell St Unit 7
- 400 Angell St
- 20 Taber Ave
- 124 Pitman St
- 42 Fremont St
- 15 Humboldt Ave
- 42 E Transit St
- 20 Governor St
- 30 S Angell St Unit 2
- 16 Governor St
- 670 Wickenden St
- 427 Wickenden St
- 228 Medway St
- 125 Taber Ave
- 374 Wickenden St
- 323 Wickenden St
- 90 University Ave
- 171 Waterman St
- 329 Ives St
- 14 E Manning St
- 173 Waterman St
- 26 E Manning St
- 335 Ives St
- 169 Waterman Ave
- 32 E Manning St
- 23 E Manning St
- 25 E Manning St
- 19 E Manning St
- 19 E Manning St Unit 1
- 19 E Manning St Unit First Floor
- 181 Waterman St
- 11 E Manning St
- 38 E Manning St
- 183 Waterman St
- 165 Waterman St Unit 1
- 165 Waterman St Unit 4
- 165 Waterman St Unit 6
Your Personal Tour Guide
Ask me questions while you tour the home.