
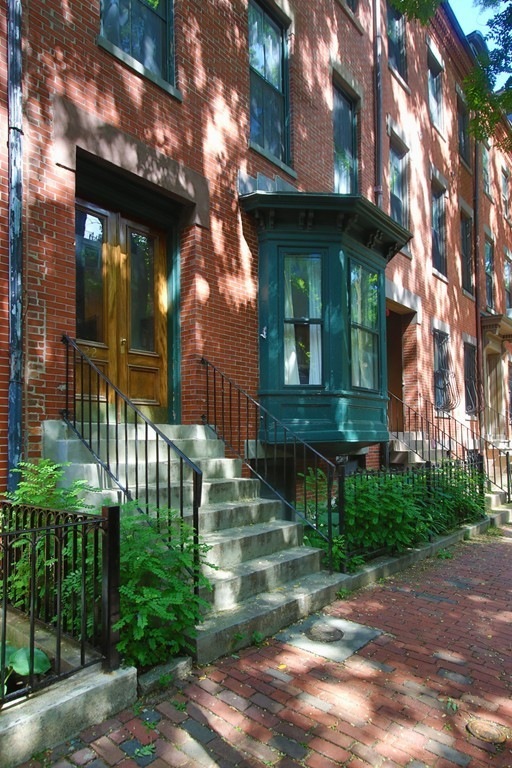
22 E Springfield St Unit 3 Boston, MA 02118
South End Neighborhood
1
Bed
1
Bath
618
Sq Ft
$150/mo
HOA Fee
About This Home
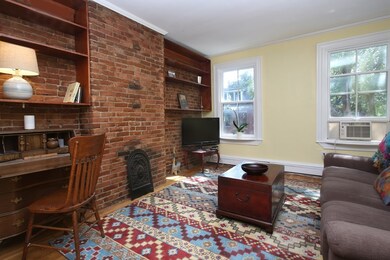
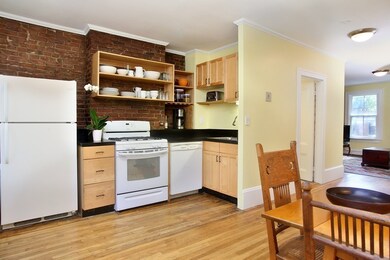
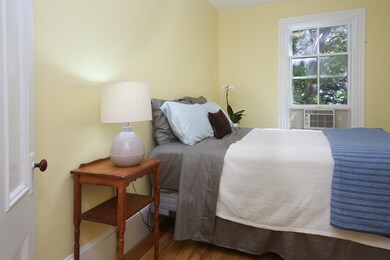
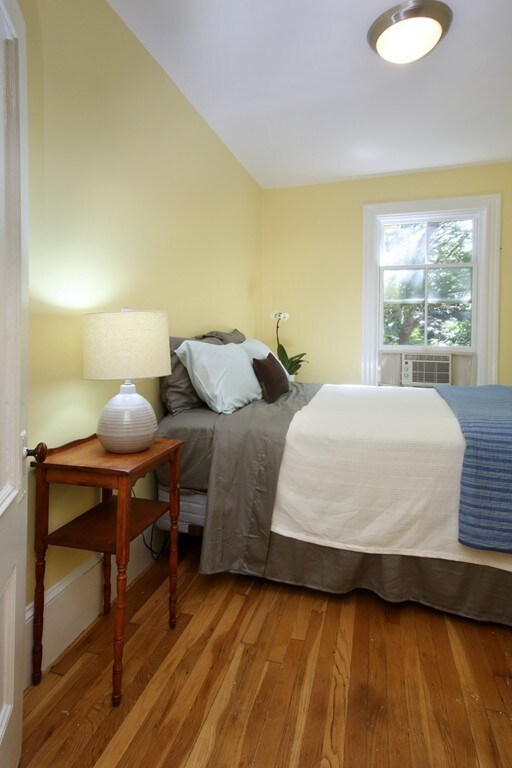
As of August 2023OPEN HOUSES CANCELLED, OFFER ACCEPTED Open concept, floor-through, 1+ bedroom located on a tree-lined street in Boston's historic South End. Surrounded by famed restaurants, quaint shops, BU Medical center, MBTA Silver line & easy access to the highway, this home is ideal for an owner occupant or as an investment unit.The sunny home offers an open floor plan w/every inch of square footage utilized. The living room features hardwoods floors and exposed brick. Additional features to include gas cooking, abundant storage, and an additional room ideal for a nursery or home office, and deck rights. Very stable, pet friendly, well-established 4 unit self managed association. The low condo fee includes heat, hot water, and gas cooking. Showings begin at the First Open House.
Last Agent to Sell the Property
Sarkis Troyer Team
Coldwell Banker Realty - Boston Listed on: 07/26/2018
Last Buyer's Agent
Derek Valentine
Charlesgate Realty Group, llc License #449586460
Property Details
Home Type
- Condominium
Est. Annual Taxes
- $7,246
Year Built
- Built in 1800
HOA Fees
- $150 per month
Kitchen
- Range
- Dishwasher
Flooring
- Wood Flooring
Utilities
- Hot Water Baseboard Heater
- Heating System Uses Gas
Community Details
- Pets Allowed
Ownership History
Date
Name
Owned For
Owner Type
Purchase Details
Listed on
Jan 2, 2019
Closed on
Feb 8, 2019
Sold by
Valentine Derek and Scheufler Alexander W
Bought by
Mintz Daniel
Seller's Agent
Derek Valentine
Charlesgate Realty Group, llc
Buyer's Agent
Tom Fleming
Boston Boutique Realty
List Price
$674,900
Sold Price
$664,970
Premium/Discount to List
-$9,930
-1.47%
Current Estimated Value
Home Financials for this Owner
Home Financials are based on the most recent Mortgage that was taken out on this home.
Estimated Appreciation
-$31,770
Avg. Annual Appreciation
-0.08%
Purchase Details
Closed on
Apr 25, 2002
Sold by
Bland Michael J
Bought by
Dallesandro Anthony
Home Financials for this Owner
Home Financials are based on the most recent Mortgage that was taken out on this home.
Original Mortgage
$207,500
Interest Rate
7.05%
Mortgage Type
Purchase Money Mortgage
Purchase Details
Closed on
Jul 1, 1996
Sold by
Kelly Douglas
Bought by
Bland Michael J
Home Financials for this Owner
Home Financials are based on the most recent Mortgage that was taken out on this home.
Original Mortgage
$66,600
Interest Rate
8.05%
Mortgage Type
Purchase Money Mortgage
Purchase Details
Closed on
Nov 14, 1991
Sold by
Jr Alex Fort
Bought by
Fhlmc
Similar Homes in the area
Create a Home Valuation Report for This Property
The Home Valuation Report is an in-depth analysis detailing your home's value as well as a comparison with similar homes in the area
Home Values in the Area
Average Home Value in this Area
Purchase History
| Date | Type | Sale Price | Title Company |
|---|---|---|---|
| Condominium Deed | $664,970 | -- | |
| Deed | $282,500 | -- | |
| Deed | $74,000 | -- | |
| Foreclosure Deed | $121,000 | -- |
Source: Public Records
Mortgage History
| Date | Status | Loan Amount | Loan Type |
|---|---|---|---|
| Previous Owner | $390,000 | New Conventional | |
| Previous Owner | $194,800 | No Value Available | |
| Previous Owner | $198,676 | No Value Available | |
| Previous Owner | $74,000 | No Value Available | |
| Previous Owner | $207,500 | Purchase Money Mortgage | |
| Previous Owner | $66,600 | Purchase Money Mortgage |
Source: Public Records
Property History
| Date | Event | Price | Change | Sq Ft Price |
|---|---|---|---|---|
| 08/04/2023 08/04/23 | Sold | $630,000 | 0.0% | $1,019 / Sq Ft |
| 07/25/2023 07/25/23 | Pending | -- | -- | -- |
| 07/02/2023 07/02/23 | Off Market | $630,000 | -- | -- |
| 06/05/2023 06/05/23 | For Sale | $664,900 | 0.0% | $1,076 / Sq Ft |
| 06/04/2023 06/04/23 | Off Market | $664,900 | -- | -- |
| 06/02/2023 06/02/23 | Price Changed | $664,900 | -1.5% | $1,076 / Sq Ft |
| 05/20/2023 05/20/23 | Price Changed | $675,000 | -2.0% | $1,092 / Sq Ft |
| 04/25/2023 04/25/23 | For Sale | $689,000 | 0.0% | $1,115 / Sq Ft |
| 08/29/2022 08/29/22 | Rented | $3,200 | 0.0% | -- |
| 08/29/2022 08/29/22 | Under Contract | -- | -- | -- |
| 08/02/2022 08/02/22 | For Rent | $3,200 | 0.0% | -- |
| 02/15/2019 02/15/19 | Sold | $664,970 | -1.5% | $1,076 / Sq Ft |
| 01/11/2019 01/11/19 | Pending | -- | -- | -- |
| 01/02/2019 01/02/19 | For Sale | $674,900 | +29.8% | $1,092 / Sq Ft |
| 09/06/2018 09/06/18 | Sold | $520,000 | +4.0% | $841 / Sq Ft |
| 07/28/2018 07/28/18 | Pending | -- | -- | -- |
| 07/26/2018 07/26/18 | For Sale | $500,000 | -- | $809 / Sq Ft |
Source: MLS Property Information Network (MLS PIN)
Tax History Compared to Growth
Tax History
| Year | Tax Paid | Tax Assessment Tax Assessment Total Assessment is a certain percentage of the fair market value that is determined by local assessors to be the total taxable value of land and additions on the property. | Land | Improvement |
|---|---|---|---|---|
| 2025 | $7,246 | $625,700 | $0 | $625,700 |
| 2024 | $6,650 | $610,100 | $0 | $610,100 |
| 2023 | $6,421 | $597,900 | $0 | $597,900 |
| 2022 | $6,442 | $592,100 | $0 | $592,100 |
| 2021 | $6,194 | $580,500 | $0 | $580,500 |
| 2020 | $5,033 | $476,600 | $0 | $476,600 |
| 2019 | $4,876 | $462,600 | $0 | $462,600 |
| 2018 | $4,572 | $436,300 | $0 | $436,300 |
| 2017 | $4,400 | $415,500 | $0 | $415,500 |
| 2016 | $4,395 | $399,500 | $0 | $399,500 |
| 2015 | $4,346 | $358,900 | $0 | $358,900 |
| 2014 | $4,097 | $325,700 | $0 | $325,700 |
Source: Public Records
Agents Affiliated with this Home
-
Seller's Agent in 2023
Alice Miles
Coldwell Banker Realty - Brookline
(617) 610-0439
1 in this area
51 Total Sales
-
Seller's Agent in 2022
Tom Fleming
Boston Boutique Realty
(617) 433-7149
39 Total Sales
-
Buyer's Agent in 2022
Ellen Grubert
Compass
(617) 256-8455
2 in this area
284 Total Sales
-
D
Seller's Agent in 2019
Derek Valentine
Charlesgate Realty Group, llc
-
S
Seller's Agent in 2018
Sarkis Troyer Team
Coldwell Banker Realty - Boston
Map
Source: MLS Property Information Network (MLS PIN)
MLS Number: 72368769
APN: CBOS-000000-000008-001489-000006
Disclaimer: Certain information contained herein is derived from information provided by parties other than Homes.com. All information provided is deemed reliable, but is not guaranteed to be accurate and should be independently verified.
![]() The property listing data and information, or the Images, set forth herein were provided to MLS Property Information Network, Inc. from third party sources, including sellers, lessors and public records, and were compiled by MLS Property Information Network, Inc. The property listing data and information, and the Images, are for the personal, non-commercial use of consumers having a good faith interest in purchasing or leasing listed properties of the type displayed to them and may not be used for any purpose other than to identify prospective properties which such consumers may have a good faith interest in purchasing or leasing. MLS Property Information Network, Inc. and its subscribers disclaim any and all representations and warranties as to the accuracy of the property listing data and information, or as to the accuracy of any of the Images, set forth herein.
The property listing data and information, or the Images, set forth herein were provided to MLS Property Information Network, Inc. from third party sources, including sellers, lessors and public records, and were compiled by MLS Property Information Network, Inc. The property listing data and information, and the Images, are for the personal, non-commercial use of consumers having a good faith interest in purchasing or leasing listed properties of the type displayed to them and may not be used for any purpose other than to identify prospective properties which such consumers may have a good faith interest in purchasing or leasing. MLS Property Information Network, Inc. and its subscribers disclaim any and all representations and warranties as to the accuracy of the property listing data and information, or as to the accuracy of any of the Images, set forth herein.
Nearby Homes
- 19 Worcester Square Unit 1
- 32 E Springfield St Unit 3
- 50 E Springfield St Unit 1
- 1 Worcester Square Unit 4
- 41 Worcester Square Unit 7
- 55 E Springfield St Unit 1
- 1682 Washington St Unit 8
- 666 Massachusetts Ave
- 7 E Springfield St Unit PH6
- 1666 Washington St Unit 3
- 1666 Washington St Unit 2
- 771 Harrison Ave Unit 208
- 771 Harrison Ave Unit 305
- 771 Harrison Ave Unit PH612
- 771 Harrison Ave Unit 9G
- 771 Harrison Ave Unit 6G
- 691 Massachusetts Ave Unit 507
- 691 Massachusetts Ave Unit 102
- 681 Massachusetts Ave Unit D
- 683 Massachusetts Ave Unit 4