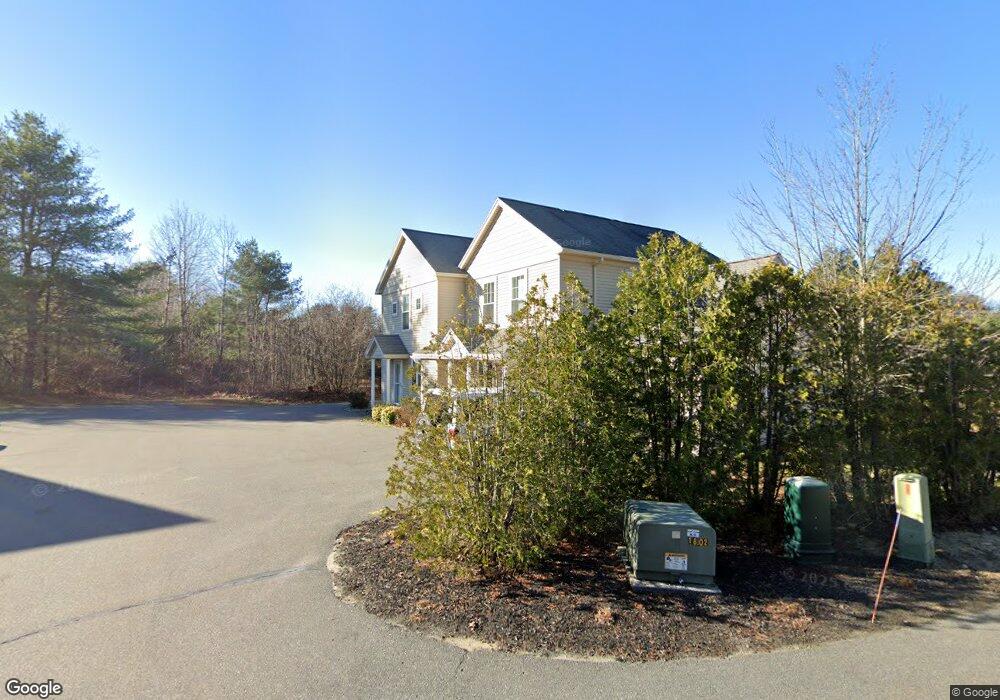
22 Edgefield Ln Unit 10 Brunswick, ME 04011
Estimated Value: $344,929 - $351,000
2
Beds
2
Baths
1,200
Sq Ft
$289/Sq Ft
Est. Value
About This Home
This home is located at 22 Edgefield Ln Unit 10, Brunswick, ME 04011 and is currently estimated at $346,982, approximately $289 per square foot. 22 Edgefield Ln Unit 10 is a home located in Cumberland County with nearby schools including Priest Elementary-Middle School, Kate Furbish Elementary School, and Brunswick Jr High School.
Ownership History
Date
Name
Owned For
Owner Type
Purchase Details
Closed on
Jul 12, 2022
Sold by
Mcfarland Jill V and Mcfarland Matthew A
Bought by
Marsh Michael
Current Estimated Value
Purchase Details
Closed on
May 22, 2019
Sold by
Lonsdale Susan E and Lonsdale Thomas S
Bought by
Mcfarland Matt and Mcfarland Jill
Purchase Details
Closed on
Feb 14, 2012
Sold by
Lonsdale Susan E
Bought by
Lonsdale Susan E and Lonsdale Thomas S
Purchase Details
Closed on
Jan 11, 2012
Sold by
Merrill Charles L Est and Merill Andrew C
Bought by
Lonsdale Susan E
Purchase Details
Closed on
Jul 14, 2009
Sold by
Bowie Home Construction
Bought by
Merrill Charles L
Home Financials for this Owner
Home Financials are based on the most recent Mortgage that was taken out on this home.
Original Mortgage
$120,000
Interest Rate
4.93%
Mortgage Type
Unknown
Create a Home Valuation Report for This Property
The Home Valuation Report is an in-depth analysis detailing your home's value as well as a comparison with similar homes in the area
Home Values in the Area
Average Home Value in this Area
Purchase History
| Date | Buyer | Sale Price | Title Company |
|---|---|---|---|
| Marsh Michael | -- | None Available | |
| Mcfarland Matt | -- | -- | |
| Lonsdale Susan E | -- | -- | |
| Lonsdale Susan E | -- | -- | |
| Merrill Charles L | -- | -- |
Source: Public Records
Mortgage History
| Date | Status | Borrower | Loan Amount |
|---|---|---|---|
| Previous Owner | Merrill Charles L | $120,000 |
Source: Public Records
Tax History Compared to Growth
Tax History
| Year | Tax Paid | Tax Assessment Tax Assessment Total Assessment is a certain percentage of the fair market value that is determined by local assessors to be the total taxable value of land and additions on the property. | Land | Improvement |
|---|---|---|---|---|
| 2024 | $3,981 | $166,900 | $60,000 | $106,900 |
| 2023 | $3,887 | $166,900 | $60,000 | $106,900 |
| 2022 | $3,629 | $167,300 | $60,000 | $107,300 |
| 2021 | $3,490 | $167,300 | $60,000 | $107,300 |
| 2020 | $3,408 | $167,300 | $60,000 | $107,300 |
| 2019 | $3,299 | $167,300 | $60,000 | $107,300 |
| 2018 | $3,165 | $167,300 | $60,000 | $107,300 |
| 2017 | $3,073 | $167,300 | $60,000 | $107,300 |
| 2016 | $2,832 | $96,500 | $10,000 | $86,500 |
| 2015 | $2,737 | $96,500 | $10,000 | $86,500 |
| 2014 | $2,644 | $96,500 | $10,000 | $86,500 |
| 2013 | -- | $96,500 | $10,000 | $86,500 |
Source: Public Records
Map
Nearby Homes
- 15 Edgefield Ln
- 152 Mckeen St Unit D17
- 8 Kyle St
- 136 Church Rd
- 19 Palmer St
- 81 Willow Grove Rd
- Lot 196 Mckeen St Unit 16
- Lot 196 Mckeen St Unit 17
- Lot 196 Mckeen St Unit 21
- 124 Columbia Ave
- 35 Signature Dr Unit 28
- 49 Signature Dr
- 19 Mast Ln Unit 19
- 29 Range Rd
- 60 County Crossing
- 26 County Crossing
- 5 Summer St
- 307 Church Rd
- 9 Village Cir
- 20 Village Cir
- 22 Edgefield Ln
- 20 Edgefield Ln
- 20 Edgefield Ln Unit 11
- 24 Edgefield Ln
- 24 Edgefield Ln Unit 9
- 26 Edgefield Ln
- 26 Edgefield Ln Unit 8
- 17 Edgefield Ln
- 17 Edgefield Ln Unit 2
- 28 Edgefield Ln
- 28 Edgefield Ln Unit 7
- 0 Edgefield Ln Unit 12
- 19 Edgefield Ln
- 19 Edgefield Ln Unit 3
- 30 Edgefield Ln
- 12 Edgefield Ln
- 32 Edgefield Ln
- 32 Edgefield Ln Unit 32
- 34 Edgefield Ln
- 34 Edgefield Ln Unit 4