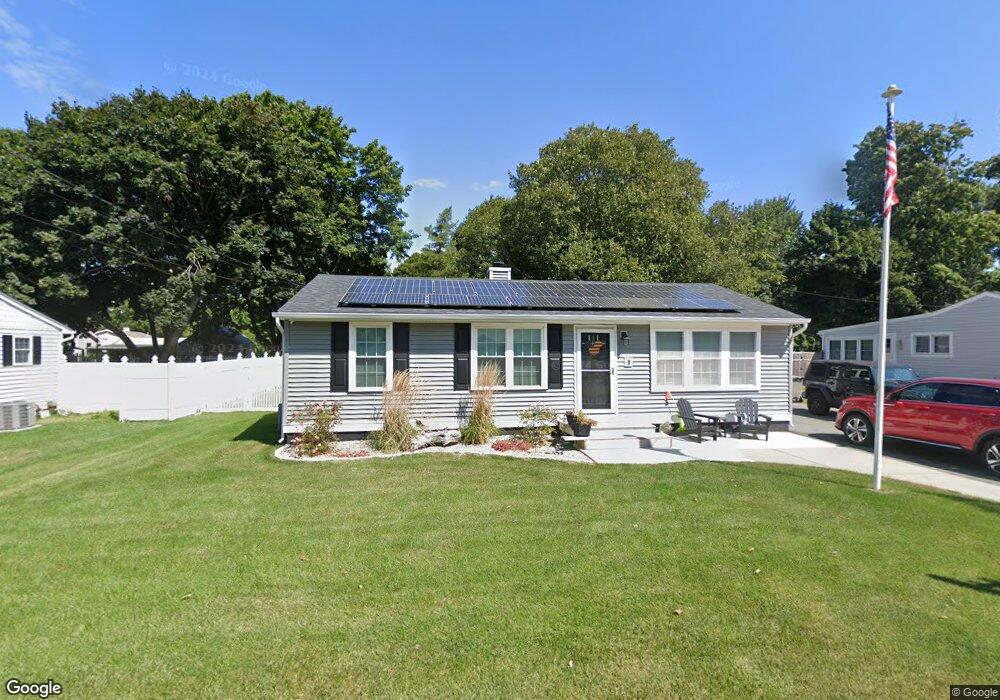
22 Edwards Rd Old Saybrook, CT 06475
Estimated Value: $597,000 - $700,000
3
Beds
1
Bath
960
Sq Ft
$660/Sq Ft
Est. Value
About This Home
This home is located at 22 Edwards Rd, Old Saybrook, CT 06475 and is currently estimated at $633,823, approximately $660 per square foot. 22 Edwards Rd is a home located in Middlesex County with nearby schools including Kathleen E. Goodwin School, Old Saybrook Middle School, and Old Saybrook Senior High School.
Ownership History
Date
Name
Owned For
Owner Type
Purchase Details
Closed on
Mar 24, 2011
Sold by
Fhlmc
Bought by
Johnson Joseph
Current Estimated Value
Home Financials for this Owner
Home Financials are based on the most recent Mortgage that was taken out on this home.
Original Mortgage
$187,052
Outstanding Balance
$125,205
Interest Rate
4.25%
Mortgage Type
FHA
Estimated Equity
$508,618
Purchase Details
Closed on
Oct 9, 2003
Sold by
Kaufmann Lynn
Bought by
Bauer Karl and Bauer Deborah
Home Financials for this Owner
Home Financials are based on the most recent Mortgage that was taken out on this home.
Original Mortgage
$170,000
Interest Rate
6.35%
Purchase Details
Closed on
Dec 20, 1999
Sold by
Marko Bohden and Marko Margaret E
Bought by
Kaufmann Lynn M
Home Financials for this Owner
Home Financials are based on the most recent Mortgage that was taken out on this home.
Original Mortgage
$40,000
Interest Rate
7.81%
Create a Home Valuation Report for This Property
The Home Valuation Report is an in-depth analysis detailing your home's value as well as a comparison with similar homes in the area
Home Values in the Area
Average Home Value in this Area
Purchase History
| Date | Buyer | Sale Price | Title Company |
|---|---|---|---|
| Johnson Joseph | $192,000 | -- | |
| Bauer Karl | $225,000 | -- | |
| Kaufmann Lynn M | $140,000 | -- |
Source: Public Records
Mortgage History
| Date | Status | Borrower | Loan Amount |
|---|---|---|---|
| Open | Kaufmann Lynn M | $187,052 | |
| Previous Owner | Kaufmann Lynn M | $207,000 | |
| Previous Owner | Kaufmann Lynn M | $170,000 | |
| Previous Owner | Kaufmann Lynn M | $40,000 |
Source: Public Records
Tax History
| Year | Tax Paid | Tax Assessment Tax Assessment Total Assessment is a certain percentage of the fair market value that is determined by local assessors to be the total taxable value of land and additions on the property. | Land | Improvement |
|---|---|---|---|---|
| 2025 | $4,131 | $266,500 | $104,000 | $162,500 |
| 2024 | $4,051 | $266,500 | $104,000 | $162,500 |
| 2023 | $3,599 | $176,000 | $74,400 | $101,600 |
| 2022 | $3,534 | $176,000 | $74,400 | $101,600 |
| 2021 | $3,529 | $176,000 | $74,400 | $101,600 |
| 2020 | $3,483 | $173,700 | $74,400 | $99,300 |
| 2019 | $3,431 | $173,700 | $74,400 | $99,300 |
| 2018 | $3,040 | $155,100 | $67,700 | $87,400 |
| 2017 | $3,049 | $155,100 | $67,700 | $87,400 |
| 2016 | $2,987 | $155,100 | $67,700 | $87,400 |
| 2015 | $2,917 | $155,100 | $67,700 | $87,400 |
| 2014 | $2,869 | $155,100 | $67,700 | $87,400 |
Source: Public Records
Map
Nearby Homes
- 10 Edwards Rd
- 1 Beamon Meadow Place
- 372 Maple Ave
- 24 W Shore Dr
- 73 Knollwood Dr
- 104 Knollwood Dr
- 105 Fenwood Dr
- 11 S View Terrace
- 33 Fenwood Rd
- 39 Middletown Ave
- 367 Main St Unit 7
- 25 Sunset Rd Unit 7
- 2 Pequot Trail
- 122 Old Post Rd
- 18 Quarry St
- 60 Ingham Hill Rd
- 1333 Boston Post Rd Unit 1
- 24 Church St
- 1333A Boston Post Rd
- 10 Mulberry St
Your Personal Tour Guide
Ask me questions while you tour the home.