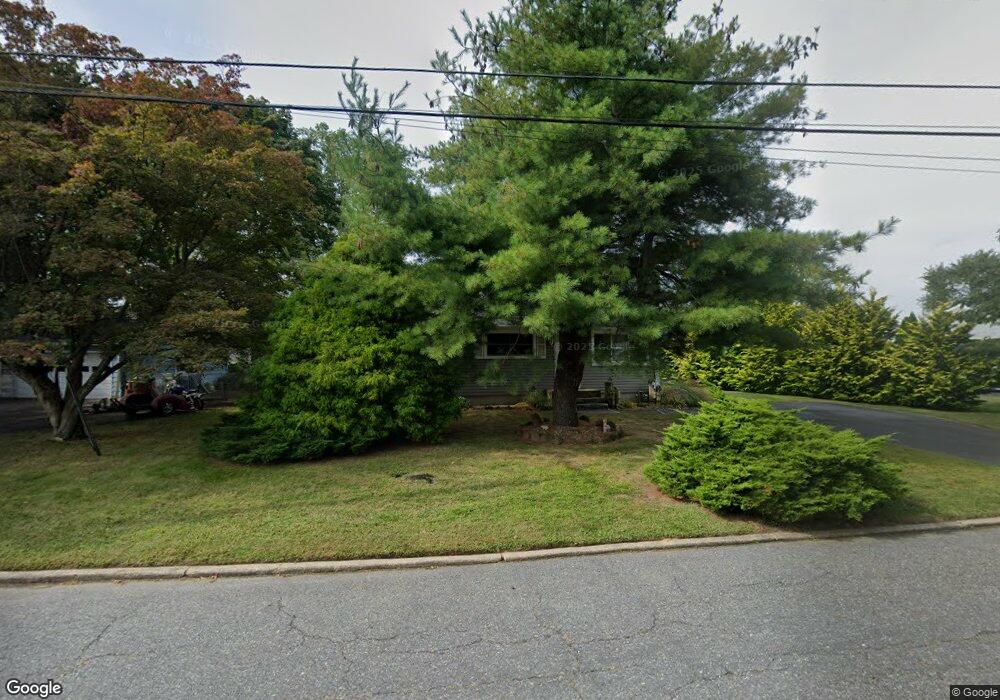
22 Elm Dr Neptune, NJ 07753
Estimated Value: $540,617 - $612,000
4
Beds
2
Baths
1,440
Sq Ft
$397/Sq Ft
Est. Value
About This Home
This home is located at 22 Elm Dr, Neptune, NJ 07753 and is currently estimated at $571,404, approximately $396 per square foot. 22 Elm Dr is a home located in Monmouth County with nearby schools including Neptune High School and Montessori Academy Of New Jersey.
Ownership History
Date
Name
Owned For
Owner Type
Purchase Details
Closed on
Apr 12, 2013
Sold by
Kiernan Susan J and Kiernan Zaleski Susan J
Bought by
Kiernan Susan J
Current Estimated Value
Home Financials for this Owner
Home Financials are based on the most recent Mortgage that was taken out on this home.
Original Mortgage
$107,000
Outstanding Balance
$75,971
Interest Rate
3.6%
Mortgage Type
New Conventional
Estimated Equity
$495,433
Purchase Details
Closed on
Nov 23, 1993
Sold by
Macdonald Mary Anne
Bought by
Zaleski Susan Kierman
Home Financials for this Owner
Home Financials are based on the most recent Mortgage that was taken out on this home.
Original Mortgage
$103,000
Interest Rate
6.69%
Create a Home Valuation Report for This Property
The Home Valuation Report is an in-depth analysis detailing your home's value as well as a comparison with similar homes in the area
Home Values in the Area
Average Home Value in this Area
Purchase History
| Date | Buyer | Sale Price | Title Company |
|---|---|---|---|
| Kiernan Susan J | -- | None Available | |
| Zaleski Susan Kierman | $105,000 | -- |
Source: Public Records
Mortgage History
| Date | Status | Borrower | Loan Amount |
|---|---|---|---|
| Open | Kiernan Susan J | $107,000 | |
| Closed | Zaleski Susan Kierman | $103,000 |
Source: Public Records
Tax History
| Year | Tax Paid | Tax Assessment Tax Assessment Total Assessment is a certain percentage of the fair market value that is determined by local assessors to be the total taxable value of land and additions on the property. | Land | Improvement |
|---|---|---|---|---|
| 2025 | $7,393 | $463,700 | $296,200 | $167,500 |
| 2024 | $7,031 | $422,200 | $232,700 | $189,500 |
| 2023 | $7,031 | $389,300 | $204,200 | $185,100 |
| 2022 | $6,174 | $330,800 | $172,700 | $158,100 |
| 2021 | $6,278 | $292,200 | $170,700 | $121,500 |
| 2020 | $6,352 | $299,900 | $184,700 | $115,200 |
| 2019 | $6,278 | $292,700 | $184,700 | $108,000 |
| 2018 | $5,612 | $258,600 | $151,400 | $107,200 |
| 2017 | $5,663 | $250,700 | $151,400 | $99,300 |
| 2016 | $5,690 | $251,200 | $156,400 | $94,800 |
| 2015 | $5,543 | $248,900 | $156,400 | $92,500 |
| 2014 | $6,130 | $226,300 | $126,400 | $99,900 |
Source: Public Records
Map
Nearby Homes
- 109 Elm Dr
- 7 Schoolhouse Rd
- 26 Pinebrook Dr
- 33 Toomin Dr
- 25 Penny Ln
- 43 Victoria Gardens Square
- 31 Victoria Gardens Square
- 46 Victoria Gardens Square
- 42 Victoria Gardens Square
- 65 Penny Ln
- 73 Penny Ln
- 67 Penny Ln
- 63 Penny Ln
- 69 Penny Ln
- 35 Victoria Gardens Square
- 37 Victoria Gardens Square
- 39 Victoria Gardens Square
- 41 Victoria Gardens Square
- 44 Victoria Gardens Square
- 48 Victoria Gardens Square
Your Personal Tour Guide
Ask me questions while you tour the home.