22 Elm St Hinesville, GA 31313
Estimated Value: $157,000 - $196,000
3
Beds
2
Baths
1,400
Sq Ft
$128/Sq Ft
Est. Value
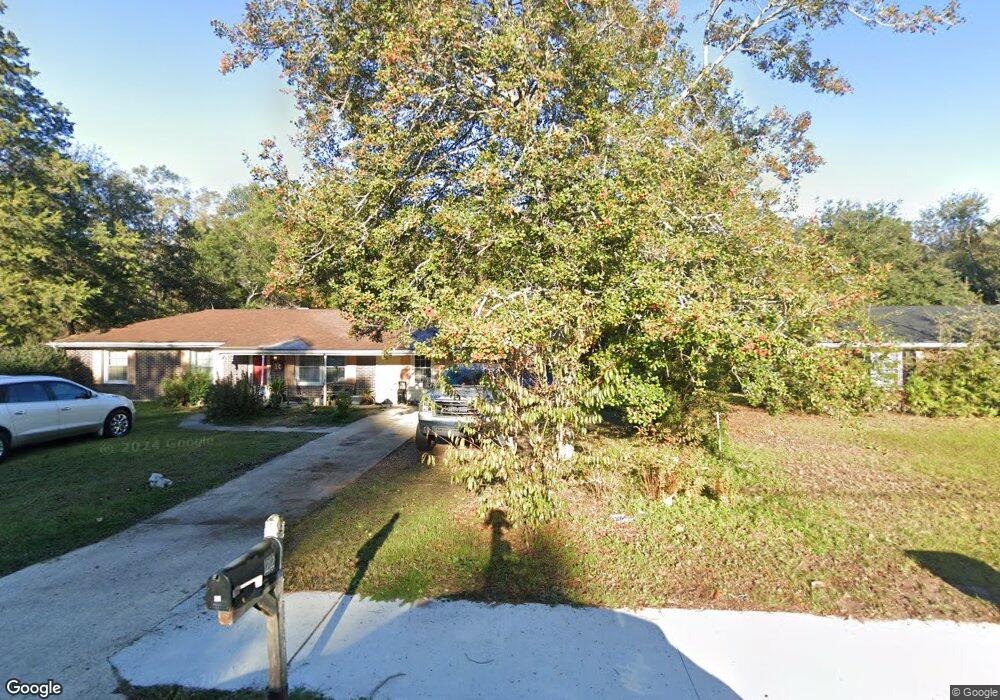
About This Home
This home is located at 22 Elm St, Hinesville, GA 31313 and is currently estimated at $179,592, approximately $128 per square foot. 22 Elm St is a home located in Liberty County with nearby schools including Waldo Pafford Elementary School, Snelson-Golden Middle School, and Bradwell Institute.
Ownership History
Date
Name
Owned For
Owner Type
Purchase Details
Closed on
May 22, 2017
Sold by
Robinson Robert L
Bought by
Robinson Mary Agnes
Current Estimated Value
Home Financials for this Owner
Home Financials are based on the most recent Mortgage that was taken out on this home.
Original Mortgage
$65,000
Outstanding Balance
$53,862
Interest Rate
3.97%
Mortgage Type
VA
Estimated Equity
$125,730
Purchase Details
Closed on
Apr 16, 2014
Sold by
Apel Roger W and Apel Shirley R
Bought by
Apel Roger W and Apel Shirley R
Purchase Details
Closed on
May 5, 1966
Bought by
Apel Roger
Create a Home Valuation Report for This Property
The Home Valuation Report is an in-depth analysis detailing your home's value as well as a comparison with similar homes in the area
Home Values in the Area
Average Home Value in this Area
Purchase History
| Date | Buyer | Sale Price | Title Company |
|---|---|---|---|
| Robinson Mary Agnes | -- | -- | |
| Robinson Robert L | $65,000 | -- | |
| Apel Roger W | -- | -- | |
| Apel Roger | -- | -- |
Source: Public Records
Mortgage History
| Date | Status | Borrower | Loan Amount |
|---|---|---|---|
| Open | Robinson Robert L | $65,000 | |
| Closed | Robinson Mary Agnes | $65,000 |
Source: Public Records
Tax History Compared to Growth
Tax History
| Year | Tax Paid | Tax Assessment Tax Assessment Total Assessment is a certain percentage of the fair market value that is determined by local assessors to be the total taxable value of land and additions on the property. | Land | Improvement |
|---|---|---|---|---|
| 2024 | $2,352 | $47,710 | $14,000 | $33,710 |
| 2023 | $2,352 | $40,610 | $12,000 | $28,610 |
| 2022 | $1,575 | $33,613 | $10,000 | $23,613 |
| 2021 | $1,380 | $28,861 | $7,200 | $21,661 |
| 2020 | $1,412 | $29,283 | $7,200 | $22,083 |
| 2019 | $1,422 | $29,704 | $7,200 | $22,504 |
| 2018 | $1,240 | $31,722 | $7,200 | $24,522 |
| 2017 | $1,058 | $32,138 | $7,200 | $24,938 |
| 2016 | $1,475 | $32,556 | $7,200 | $25,356 |
| 2015 | $781 | $31,556 | $6,200 | $25,356 |
| 2014 | $781 | $31,503 | $7,200 | $24,303 |
| 2013 | -- | $29,370 | $7,200 | $22,170 |
Source: Public Records
Map
Nearby Homes