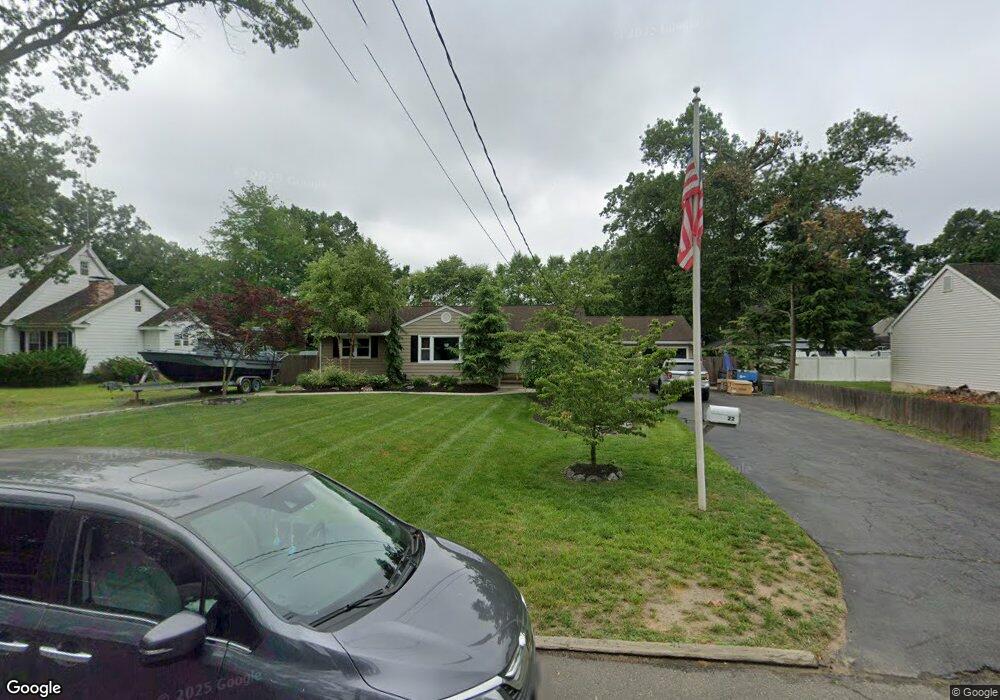
22 Elm St Spotswood, NJ 08884
Estimated Value: $498,000 - $528,482
3
Beds
2
Baths
1,188
Sq Ft
$431/Sq Ft
Est. Value
About This Home
This home is located at 22 Elm St, Spotswood, NJ 08884 and is currently estimated at $512,371, approximately $431 per square foot. 22 Elm St is a home located in Middlesex County with nearby schools including G. Austin Schoenly Elementary School, E. Raymond Appleby Elementary School, and Spotswood Memorial School.
Ownership History
Date
Name
Owned For
Owner Type
Purchase Details
Closed on
Jul 16, 2015
Sold by
Netta William
Bought by
Gregus John G
Current Estimated Value
Home Financials for this Owner
Home Financials are based on the most recent Mortgage that was taken out on this home.
Original Mortgage
$253,326
Outstanding Balance
$200,182
Interest Rate
4.25%
Mortgage Type
FHA
Estimated Equity
$312,189
Purchase Details
Closed on
Oct 31, 2005
Sold by
Mclaughlin Joan
Bought by
Netta William
Home Financials for this Owner
Home Financials are based on the most recent Mortgage that was taken out on this home.
Original Mortgage
$297,600
Interest Rate
6.07%
Mortgage Type
New Conventional
Purchase Details
Closed on
Apr 21, 1994
Sold by
Duffy Gerald
Bought by
Mclaughlin Joan
Create a Home Valuation Report for This Property
The Home Valuation Report is an in-depth analysis detailing your home's value as well as a comparison with similar homes in the area
Home Values in the Area
Average Home Value in this Area
Purchase History
| Date | Buyer | Sale Price | Title Company |
|---|---|---|---|
| Gregus John G | $258,000 | Sage Title And Settlement | |
| Netta William | $372,000 | -- | |
| Mclaughlin Joan | $157,500 | -- |
Source: Public Records
Mortgage History
| Date | Status | Borrower | Loan Amount |
|---|---|---|---|
| Open | Gregus John G | $253,326 | |
| Previous Owner | Netta William | $297,600 |
Source: Public Records
Tax History Compared to Growth
Tax History
| Year | Tax Paid | Tax Assessment Tax Assessment Total Assessment is a certain percentage of the fair market value that is determined by local assessors to be the total taxable value of land and additions on the property. | Land | Improvement |
|---|---|---|---|---|
| 2025 | $9,605 | $263,800 | $148,500 | $115,300 |
| 2024 | $9,447 | $263,800 | $148,500 | $115,300 |
| 2023 | $9,447 | $263,800 | $148,500 | $115,300 |
| 2022 | $9,254 | $263,800 | $148,500 | $115,300 |
| 2021 | $9,180 | $263,800 | $148,500 | $115,300 |
| 2020 | $8,967 | $263,800 | $148,500 | $115,300 |
| 2019 | $8,761 | $263,800 | $148,500 | $115,300 |
| 2018 | $8,550 | $263,800 | $148,500 | $115,300 |
| 2017 | $8,399 | $263,800 | $148,500 | $115,300 |
| 2016 | $8,175 | $263,800 | $148,500 | $115,300 |
| 2015 | $7,803 | $263,800 | $148,500 | $115,300 |
| 2014 | $7,735 | $263,800 | $148,500 | $115,300 |
Source: Public Records
Map
Nearby Homes
- 137 Wilson Ave
- 294 Devoe Ave
- 22 Herman Dr
- 59 Devoe Ave
- 6 Monmouth Rd
- 24 Harrigan Ave
- 549 Main St
- 58 Manalapan Rd
- 35 Ashmall Ave
- 106 Manalapan Rd
- 12 Spotswood Ave
- 35 Monmouth Rd
- 29 de Stefano Ave
- 20 1st Ave
- 321 Main St
- 35 Maiden Ln
- 19 Evergreen Terrace
- 289 Main St Unit 9R
- 289 Main St Unit 4P
- 3 Patton Place