Estimated Value: $136,165 - $177,000
--
Bed
--
Bath
925
Sq Ft
$179/Sq Ft
Est. Value
About This Home
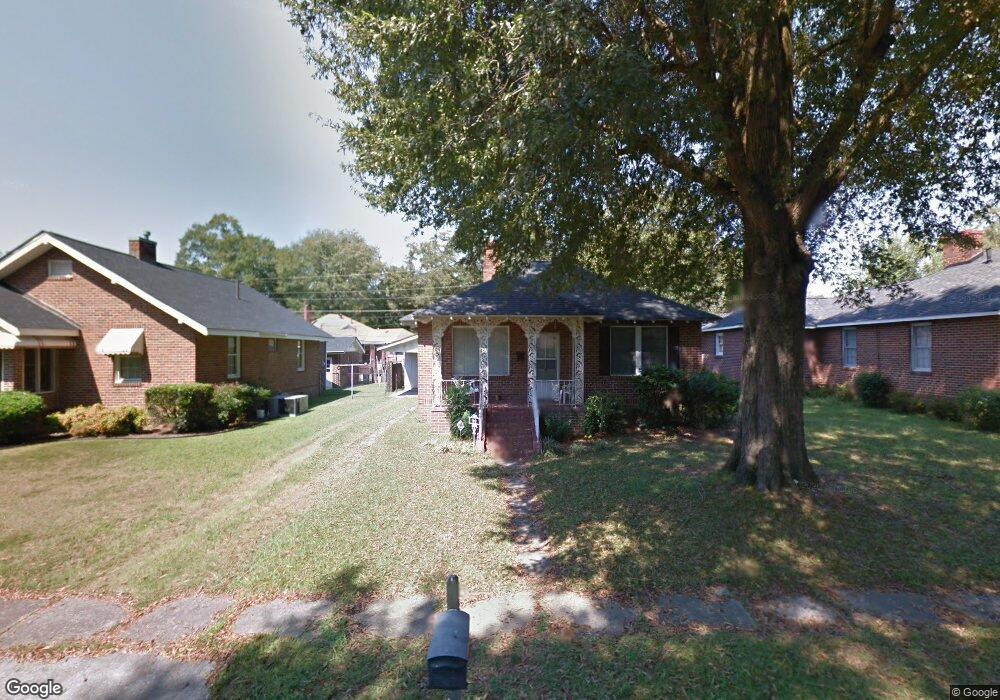
This home is located at 22 Elmwood St NE, Rome, GA 30161 and is currently estimated at $165,291, approximately $178 per square foot. 22 Elmwood St NE is a home located in Floyd County with nearby schools including Model Middle School, Model High School, and Unity Christian School.
Ownership History
Date
Name
Owned For
Owner Type
Purchase Details
Closed on
Jun 8, 2001
Sold by
Thomas Dean J
Bought by
Carter David L
Current Estimated Value
Purchase Details
Closed on
May 4, 1999
Sold by
Burk Anastasia
Bought by
Thomas Dean J
Purchase Details
Closed on
Nov 14, 1997
Sold by
Carroll Ii Jack R and Mary Anne Carroll
Bought by
Burk Anastasia
Purchase Details
Closed on
Sep 20, 1996
Sold by
Carroll Ii Jack R
Bought by
Carroll Ii Jack R and Mary Anne Carro
Purchase Details
Closed on
Dec 19, 1994
Sold by
Mclemore Arvie Jeanette
Bought by
Bennett Amy Charlesean
Purchase Details
Closed on
Jun 22, 1990
Sold by
Finch Anna Dell
Bought by
Mclemore Arvie Jeanette
Purchase Details
Closed on
Jan 22, 1963
Sold by
Fox Marshall
Bought by
Finch Anna Dell
Purchase Details
Closed on
Jan 2, 1901
Sold by
Fox Fox M and Fox Jacqueline S
Bought by
Fox Marshall
Purchase Details
Closed on
Jan 1, 1901
Bought by
Fox Fox M and Fox Jacqueline S
Create a Home Valuation Report for This Property
The Home Valuation Report is an in-depth analysis detailing your home's value as well as a comparison with similar homes in the area
Home Values in the Area
Average Home Value in this Area
Purchase History
| Date | Buyer | Sale Price | Title Company |
|---|---|---|---|
| Carter David L | $73,000 | -- | |
| Thomas Dean J | $62,500 | -- | |
| Burk Anastasia | $56,900 | -- | |
| Carroll Ii Jack R | -- | -- | |
| Carroll Ii Jack R | $49,500 | -- | |
| Bennett Amy Charlesean | $38,500 | -- | |
| Mclemore Arvie Jeanette | $27,000 | -- | |
| Finch Anna Dell | -- | -- | |
| Fox Marshall | -- | -- | |
| Fox Fox M | -- | -- |
Source: Public Records
Tax History Compared to Growth
Tax History
| Year | Tax Paid | Tax Assessment Tax Assessment Total Assessment is a certain percentage of the fair market value that is determined by local assessors to be the total taxable value of land and additions on the property. | Land | Improvement |
|---|---|---|---|---|
| 2024 | $1,449 | $45,339 | $9,659 | $35,680 |
| 2023 | $1,332 | $40,653 | $8,673 | $31,980 |
| 2022 | $947 | $30,694 | $7,096 | $23,598 |
| 2021 | $883 | $28,102 | $7,096 | $21,006 |
| 2020 | $798 | $25,131 | $5,421 | $19,710 |
| 2019 | $726 | $23,153 | $5,421 | $17,732 |
| 2018 | $689 | $21,905 | $5,421 | $16,484 |
| 2017 | $667 | $21,151 | $5,421 | $15,730 |
| 2016 | $689 | $21,600 | $6,160 | $15,440 |
| 2015 | $770 | $20,120 | $2,560 | $17,560 |
| 2014 | $770 | $29,330 | $2,560 | $26,770 |
Source: Public Records
Map
Nearby Homes
- 23 Oak St NE
- 27 Oak St NE
- 42 Dogwood St NE
- 40 Dogwood St NE
- 1 Fir St NE
- 7 Ash St NE
- 0 Cypress St NE Unit 7494593
- 0 Cypress St NE Unit 10422946
- 0 Euclid Ave Unit 10617853
- 205 Couper St NE
- 311 Reynolds St NE
- 411 Woodward St NE
- 219 North Ave NE
- 541 Reece St NE
- 4 N Haven Dr
- 302 Tolbert St
- 17 Joplin St NE
- 2 Lindberg Dr NE
- 0 Veterans Memorial Hwy NE Unit 10565194
- 0 Veterans Memorial Hwy NE Unit 10503178
- 24 Elmwood St NE
- 20 Elmwood St NE
- 1 Oak St NE
- 1 Oak St NE Unit PIN
- 26 Elmwood St NE
- 3 Oak St NE
- 18 Elmwood St NE
- 17 Elmwood St NE
- 28 Elmwood St NE
- 19 Elmwood St NE
- 15 Elmwood St NE
- 41 Ash St NE
- 39 Ash St NE
- 16 Elmwood St NE
- 30 Elmwood St NE
- 37 Ash St NE
- 23 Elmwood St NE
- 0 Green St NE Unit 7370509
- 0 Green St NE Unit 8396230
- 9 Green St NE