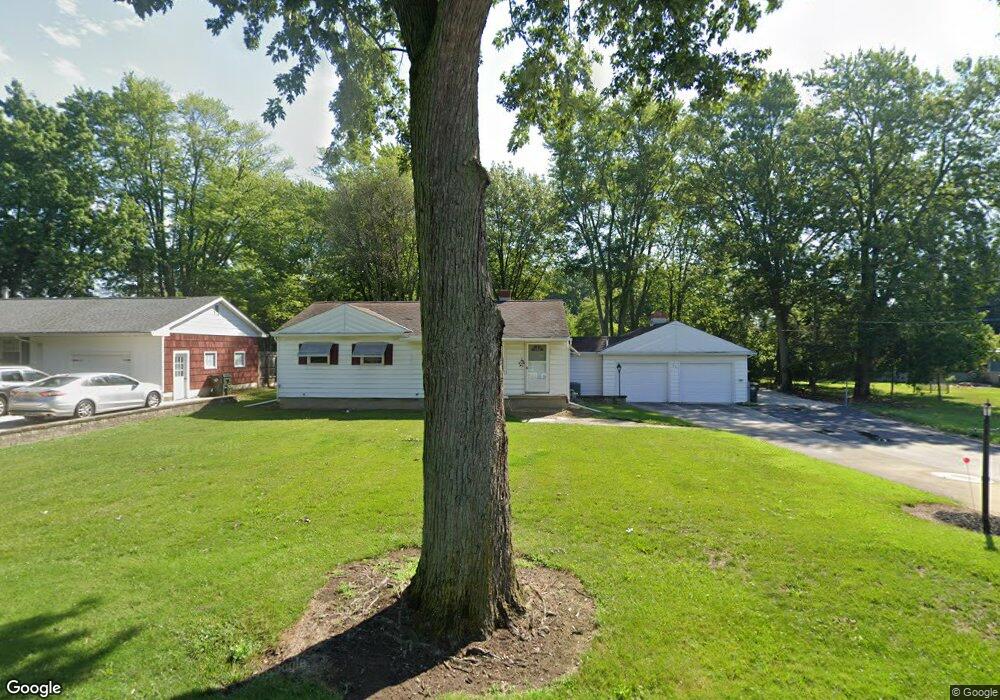
22 Elmwood St Tiffin, OH 44883
Estimated Value: $150,000 - $184,492
3
Beds
2
Baths
960
Sq Ft
$175/Sq Ft
Est. Value
About This Home
This home is located at 22 Elmwood St, Tiffin, OH 44883 and is currently estimated at $167,623, approximately $174 per square foot. 22 Elmwood St is a home located in Seneca County with nearby schools including Columbian High School, Calvert High School, and Calvert Catholic Elementary School.
Ownership History
Date
Name
Owned For
Owner Type
Purchase Details
Closed on
Apr 12, 2002
Sold by
Hunt Kathy K
Bought by
Gibson Cindra K
Current Estimated Value
Purchase Details
Closed on
Apr 9, 1998
Bought by
Hunt Kathy K
Purchase Details
Closed on
Jan 16, 1996
Sold by
Luhring Kathy K
Bought by
Residential Living Ltd
Purchase Details
Closed on
Sep 1, 1993
Sold by
Downey Judith A
Bought by
Luhring Kathy K
Purchase Details
Closed on
Jan 24, 1992
Sold by
Courtney Thomas E
Bought by
Downey Judith A
Purchase Details
Closed on
Mar 22, 1991
Sold by
Courtney Thomas E
Bought by
Courtney Thomas E
Create a Home Valuation Report for This Property
The Home Valuation Report is an in-depth analysis detailing your home's value as well as a comparison with similar homes in the area
Home Values in the Area
Average Home Value in this Area
Purchase History
| Date | Buyer | Sale Price | Title Company |
|---|---|---|---|
| Gibson Cindra K | $109,000 | -- | |
| Hunt Kathy K | -- | -- | |
| Residential Living Ltd | -- | -- | |
| Luhring Kathy K | -- | -- | |
| Downey Judith A | $58,000 | -- | |
| Courtney Thomas E | -- | -- |
Source: Public Records
Tax History Compared to Growth
Tax History
| Year | Tax Paid | Tax Assessment Tax Assessment Total Assessment is a certain percentage of the fair market value that is determined by local assessors to be the total taxable value of land and additions on the property. | Land | Improvement |
|---|---|---|---|---|
| 2024 | $1,641 | $48,620 | $11,040 | $37,580 |
| 2023 | $1,642 | $48,620 | $11,040 | $37,580 |
| 2022 | $1,356 | $33,320 | $9,380 | $23,940 |
| 2021 | $1,366 | $33,320 | $9,380 | $23,940 |
| 2020 | $1,392 | $33,328 | $9,384 | $23,944 |
| 2019 | $1,381 | $31,990 | $9,198 | $22,792 |
| 2018 | $1,384 | $31,990 | $9,198 | $22,792 |
| 2017 | $1,357 | $31,990 | $9,198 | $22,792 |
| 2016 | $1,330 | $31,182 | $8,922 | $22,260 |
| 2015 | $1,315 | $31,182 | $8,922 | $22,260 |
| 2014 | $1,239 | $31,182 | $8,922 | $22,260 |
| 2013 | $1,324 | $32,130 | $9,198 | $22,932 |
Source: Public Records
Map
Nearby Homes