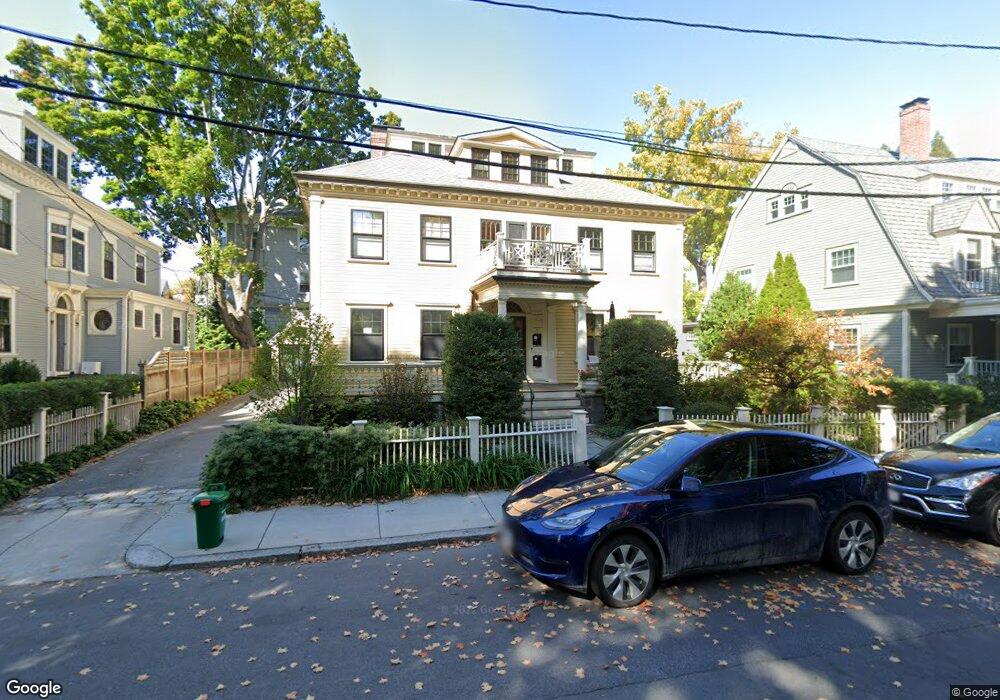
22 Emerson St Brookline, MA 02445
Brookline Village NeighborhoodEstimated Value: $3,094,000 - $3,436,944
6
Beds
5
Baths
4,327
Sq Ft
$756/Sq Ft
Est. Value
About This Home
This home is located at 22 Emerson St, Brookline, MA 02445 and is currently estimated at $3,271,986, approximately $756 per square foot. 22 Emerson St is a home located in Norfolk County with nearby schools including Pierce School, Brookline High School, and St. Mary of the Assumption Elementary School.
Ownership History
Date
Name
Owned For
Owner Type
Purchase Details
Closed on
Aug 10, 2004
Sold by
Sagov Carolyn L
Bought by
Osborn Lynn C and Osborn William C
Current Estimated Value
Home Financials for this Owner
Home Financials are based on the most recent Mortgage that was taken out on this home.
Original Mortgage
$1,100,000
Outstanding Balance
$552,703
Interest Rate
6.2%
Mortgage Type
Purchase Money Mortgage
Estimated Equity
$2,719,283
Create a Home Valuation Report for This Property
The Home Valuation Report is an in-depth analysis detailing your home's value as well as a comparison with similar homes in the area
Home Values in the Area
Average Home Value in this Area
Purchase History
| Date | Buyer | Sale Price | Title Company |
|---|---|---|---|
| Osborn Lynn C | $1,610,000 | -- |
Source: Public Records
Mortgage History
| Date | Status | Borrower | Loan Amount |
|---|---|---|---|
| Open | Osborn Lynn C | $1,100,000 |
Source: Public Records
Tax History
| Year | Tax Paid | Tax Assessment Tax Assessment Total Assessment is a certain percentage of the fair market value that is determined by local assessors to be the total taxable value of land and additions on the property. | Land | Improvement |
|---|---|---|---|---|
| 2025 | $32,557 | $3,298,600 | $1,242,200 | $2,056,400 |
| 2024 | $31,057 | $3,178,800 | $1,194,400 | $1,984,400 |
| 2023 | $28,520 | $2,860,600 | $957,000 | $1,903,600 |
| 2022 | $27,761 | $2,724,300 | $911,400 | $1,812,900 |
| 2021 | $25,671 | $2,619,500 | $876,300 | $1,743,200 |
| 2020 | $23,782 | $2,516,600 | $796,600 | $1,720,000 |
| 2019 | $22,344 | $2,384,600 | $758,700 | $1,625,900 |
| 2018 | $21,425 | $2,264,800 | $689,700 | $1,575,100 |
| 2017 | $21,110 | $2,136,600 | $650,600 | $1,486,000 |
| 2016 | $20,807 | $1,996,800 | $608,100 | $1,388,700 |
| 2015 | $20,047 | $1,877,100 | $568,300 | $1,308,800 |
| 2014 | $21,012 | $1,844,800 | $516,600 | $1,328,200 |
Source: Public Records
Map
Nearby Homes
- 11 Goodwin Place Unit 1
- 11 Goodwin Place Unit 11-1
- 11 Goodwin Place Unit 11-2
- 12 Goodwin Place Unit 12-1
- 12 Goodwin Place Unit 12-2
- 370 Washington St
- 12 Thayer St
- 401 Washington St Unit 6
- 8 Leverett St Unit 3
- 441 Washington St Unit 5
- 75-83 Boylston St Unit R3
- 71 Greenough St Unit 71-1
- 75 Greenough St Unit 2
- 3 Upland Rd Unit 2
- 69 Walnut St Unit 2
- 69 Walnut St Unit 1
- 236 Walnut St
- 106 Brook St
- 140 Sumner Rd Unit 1
- 80 Park St Unit 75
- 28 Emerson St
- 16 Emerson St
- 27 Elm St Unit 3
- 27 Elm St
- 27 Elm St Unit 1
- 29 Elm St Unit 3
- 29 Elm St Unit One
- 29 Elm St Unit 1
- 29 Elm St
- 29 Elm St Unit 2
- 36 Waverly St
- 34 Emerson St
- 38 Emerson St
- 44 Waverly St Unit 46
- 46 Waverly St
- 46 Waverly St Unit 1
- 46 Waverly St
- 46 Waverly St Unit 2
- 23 Elm St Unit 25
- 19 Elm St Unit 21
Your Personal Tour Guide
Ask me questions while you tour the home.