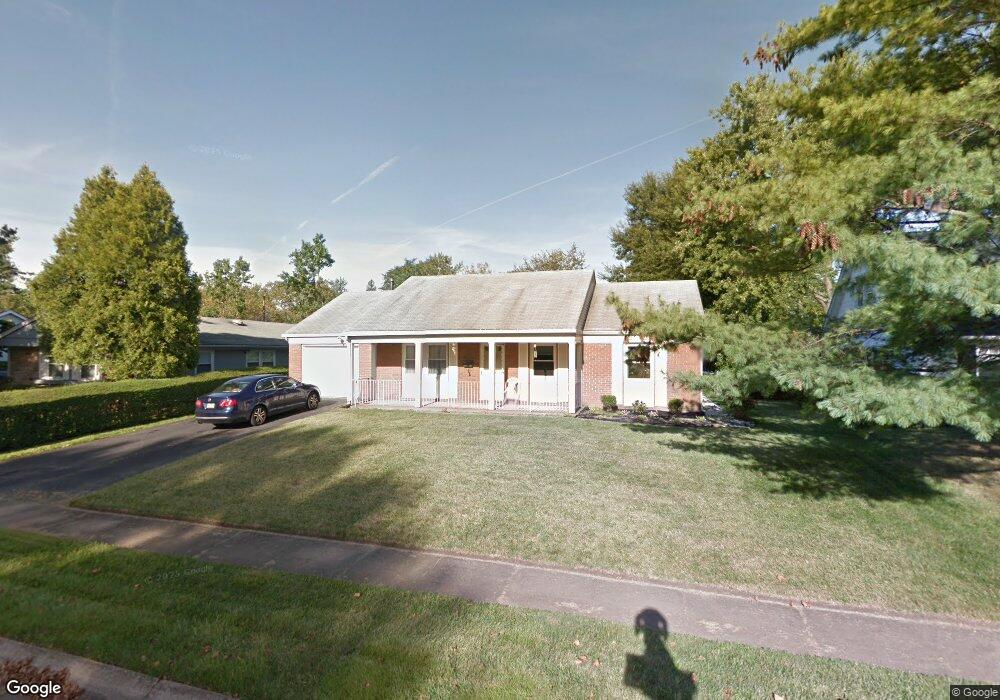
22 Enderly Ln Willingboro, NJ 08046
Estimated Value: $311,000 - $376,000
--
Bed
--
Bath
1,322
Sq Ft
$257/Sq Ft
Est. Value
About This Home
This home is located at 22 Enderly Ln, Willingboro, NJ 08046 and is currently estimated at $339,859, approximately $257 per square foot. 22 Enderly Ln is a home located in Burlington County with nearby schools including Twin Hills Elementary School, Memorial Middle School, and Levitt Intermediate School.
Ownership History
Date
Name
Owned For
Owner Type
Purchase Details
Closed on
Dec 6, 2004
Sold by
Melvin Tora M and Melvin Mwanza L
Bought by
Tricoche Morrow Bernice
Current Estimated Value
Home Financials for this Owner
Home Financials are based on the most recent Mortgage that was taken out on this home.
Original Mortgage
$172,500
Interest Rate
9.4%
Mortgage Type
Purchase Money Mortgage
Purchase Details
Closed on
Oct 29, 1999
Sold by
Easton Mary Ann
Bought by
Williams Tara M
Home Financials for this Owner
Home Financials are based on the most recent Mortgage that was taken out on this home.
Original Mortgage
$91,922
Interest Rate
7.73%
Mortgage Type
FHA
Purchase Details
Closed on
Jan 10, 1997
Sold by
Easton James B and Easton Mary Ann
Bought by
Easton James B and Easton Mary Ann
Create a Home Valuation Report for This Property
The Home Valuation Report is an in-depth analysis detailing your home's value as well as a comparison with similar homes in the area
Home Values in the Area
Average Home Value in this Area
Purchase History
| Date | Buyer | Sale Price | Title Company |
|---|---|---|---|
| Tricoche Morrow Bernice | $172,500 | Congress Title Corp | |
| Williams Tara M | $92,000 | Collegiate Title & Abstract | |
| Easton James B | -- | -- |
Source: Public Records
Mortgage History
| Date | Status | Borrower | Loan Amount |
|---|---|---|---|
| Previous Owner | Tricoche Morrow Bernice | $172,500 | |
| Previous Owner | Williams Tara M | $91,922 |
Source: Public Records
Tax History Compared to Growth
Tax History
| Year | Tax Paid | Tax Assessment Tax Assessment Total Assessment is a certain percentage of the fair market value that is determined by local assessors to be the total taxable value of land and additions on the property. | Land | Improvement |
|---|---|---|---|---|
| 2025 | $6,130 | $142,000 | $43,100 | $98,900 |
| 2024 | $6,085 | $142,000 | $43,100 | $98,900 |
| 2023 | $6,085 | $142,000 | $43,100 | $98,900 |
| 2022 | $5,664 | $142,000 | $43,100 | $98,900 |
| 2021 | $5,178 | $142,000 | $43,100 | $98,900 |
| 2020 | $5,698 | $142,000 | $43,100 | $98,900 |
| 2019 | $5,645 | $142,000 | $43,100 | $98,900 |
| 2018 | $5,539 | $142,000 | $43,100 | $98,900 |
| 2017 | $5,385 | $142,000 | $43,100 | $98,900 |
| 2016 | $5,331 | $142,000 | $43,100 | $98,900 |
| 2015 | $5,148 | $142,000 | $43,100 | $98,900 |
| 2014 | $4,900 | $142,000 | $43,100 | $98,900 |
Source: Public Records
Map
Nearby Homes