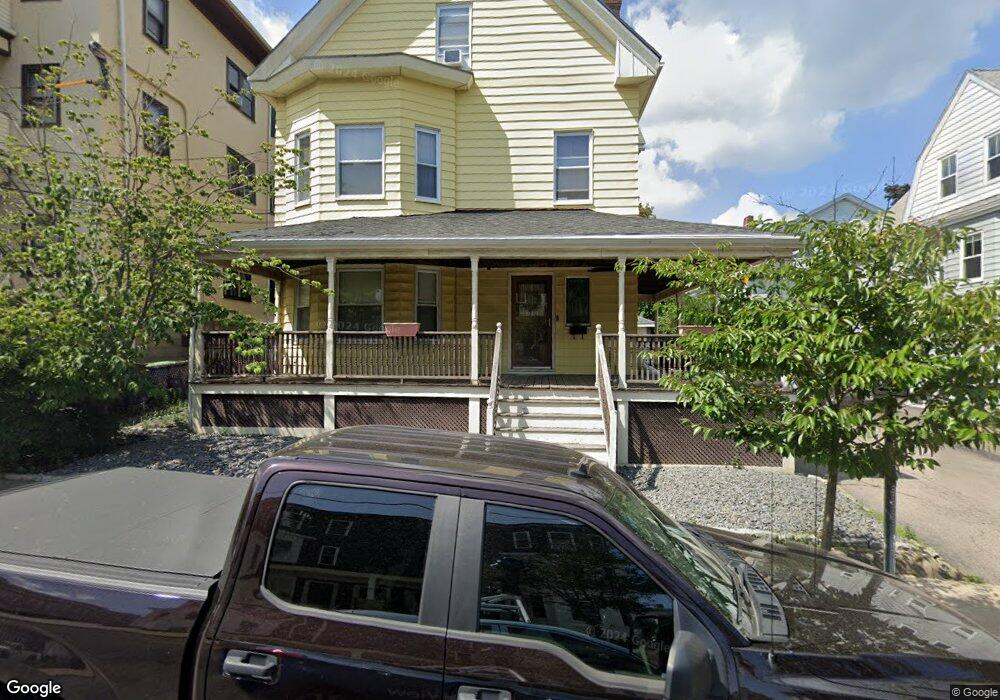
22 Fenwick St Somerville, MA 02145
Ten Hills NeighborhoodEstimated Value: $1,090,997 - $1,284,000
5
Beds
2
Baths
2,971
Sq Ft
$393/Sq Ft
Est. Value
About This Home
This home is located at 22 Fenwick St, Somerville, MA 02145 and is currently estimated at $1,168,749, approximately $393 per square foot. 22 Fenwick St is a home located in Middlesex County with nearby schools including Somerville High School and Bright Future Educare Center.
Ownership History
Date
Name
Owned For
Owner Type
Purchase Details
Closed on
Jun 17, 1998
Sold by
Est Galimi Hannah and Galimi Joseph J
Bought by
Cirrone Michael and Cirrone Michelle A
Current Estimated Value
Home Financials for this Owner
Home Financials are based on the most recent Mortgage that was taken out on this home.
Original Mortgage
$120,000
Interest Rate
7.09%
Mortgage Type
Purchase Money Mortgage
Create a Home Valuation Report for This Property
The Home Valuation Report is an in-depth analysis detailing your home's value as well as a comparison with similar homes in the area
Home Values in the Area
Average Home Value in this Area
Purchase History
We collect this data history from publicly available records. To have your information removed, we recommend requesting removal directly through your county’s website.
| Date | Buyer | Sale Price | Title Company |
|---|---|---|---|
| Cirrone Michael | $150,000 | -- |
Source: Public Records
Mortgage History
We collect this data history from publicly available records. To have your information removed, we recommend requesting removal directly through your county’s website.
| Date | Status | Borrower | Loan Amount |
|---|---|---|---|
| Open | Cirrone Michael | $175,000 | |
| Closed | Cirrone Michael | $35,000 | |
| Closed | Cirrone Michael | $120,000 |
Source: Public Records
Tax History
| Year | Tax Paid | Tax Assessment Tax Assessment Total Assessment is a certain percentage of the fair market value that is determined by local assessors to be the total taxable value of land and additions on the property. | Land | Improvement |
|---|---|---|---|---|
| 2025 | $10,002 | $916,800 | $353,700 | $563,100 |
| 2024 | $9,542 | $907,000 | $353,700 | $553,300 |
| 2023 | $8,996 | $870,000 | $353,700 | $516,300 |
| 2022 | $8,485 | $833,500 | $336,900 | $496,600 |
| 2021 | $7,903 | $775,600 | $306,100 | $469,500 |
| 2020 | $7,432 | $736,600 | $294,200 | $442,400 |
| 2019 | $6,762 | $628,400 | $247,600 | $380,800 |
| 2018 | $6,174 | $545,900 | $225,100 | $320,800 |
| 2017 | $6,081 | $521,100 | $212,400 | $308,700 |
| 2016 | $5,685 | $453,700 | $172,400 | $281,300 |
| 2015 | $5,680 | $450,400 | $171,500 | $278,900 |
Source: Public Records
Map
Nearby Homes
- 8 Douglas Ave
- 115 Thurston St Unit I
- 34 Heath St Unit 3
- 134 Heath St Unit 3
- 13 Langmaid Ave Unit 1
- 13 Langmaid Ave Unit 3
- 7 Meacham St Unit 7
- 7 Meacham St
- 3 Heath St Unit 2
- 326 Broadway Unit 6
- 33 Sewall St
- 64 Derby St Unit 4
- 39 Ash Ave
- 60 Derby St Unit 5
- 60 Derby St Unit 3
- 12 Kilsyth Rd
- 48 Ash Ave Unit B
- 41 Derby St Unit 2
- 13 Leyden St
- 23 Jaques St Unit B
- 17 Bond St Unit 1
- 17 Bond St Unit 3
- 17 Bond St Unit 2
- 17 Bond St
- 17 Bond St Unit A
- 17 Bond St
- 80 Heath St
- 15 Bond St
- 82 Heath St Unit 1
- 82 Heath St
- 76 Heath St
- 76 Heath St Unit 76
- 76 Heath St Unit 2
- 74 Heath St
- 74 Heath St Unit 1
- 74 Heath St Unit 74
- 11 Bond St
- 11 Bond St Unit 1
- 11 Bond St Unit 2
- 11 Bond St Unit 3
Your Personal Tour Guide
Ask me questions while you tour the home.