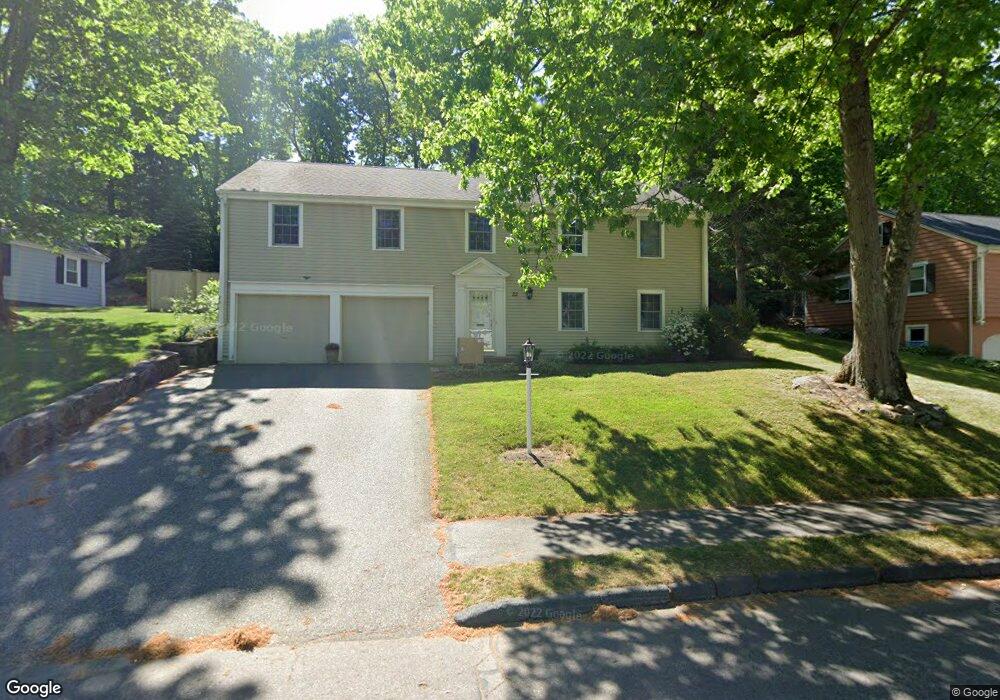
22 Fernway Lynnfield, MA 01940
Estimated Value: $806,000 - $1,023,000
3
Beds
2
Baths
1,758
Sq Ft
$521/Sq Ft
Est. Value
About This Home
This home is located at 22 Fernway, Lynnfield, MA 01940 and is currently estimated at $916,246, approximately $521 per square foot. 22 Fernway is a home located in Essex County with nearby schools including Lynnfield Middle School, Pickering Middle School, and Lynnfield High School.
Ownership History
Date
Name
Owned For
Owner Type
Purchase Details
Closed on
Apr 19, 2006
Sold by
Pearson Carl E
Bought by
Pearson Carl E
Current Estimated Value
Purchase Details
Closed on
May 24, 1993
Sold by
Correggia William and Correggia Patricia
Bought by
Pearson Carl E
Create a Home Valuation Report for This Property
The Home Valuation Report is an in-depth analysis detailing your home's value as well as a comparison with similar homes in the area
Home Values in the Area
Average Home Value in this Area
Purchase History
| Date | Buyer | Sale Price | Title Company |
|---|---|---|---|
| Pearson Carl E | -- | -- | |
| Pearson Carl E | $241,000 | -- |
Source: Public Records
Mortgage History
| Date | Status | Borrower | Loan Amount |
|---|---|---|---|
| Open | Pearson Carl E | $295,500 | |
| Closed | Pearson Carl E | $315,000 | |
| Closed | Pearson Carl E | $270,000 |
Source: Public Records
Tax History Compared to Growth
Tax History
| Year | Tax Paid | Tax Assessment Tax Assessment Total Assessment is a certain percentage of the fair market value that is determined by local assessors to be the total taxable value of land and additions on the property. | Land | Improvement |
|---|---|---|---|---|
| 2025 | $9,131 | $864,700 | $564,300 | $300,400 |
| 2024 | $8,739 | $831,500 | $542,600 | $288,900 |
| 2023 | $8,727 | $772,300 | $514,600 | $257,700 |
| 2022 | $8,314 | $693,400 | $472,600 | $220,800 |
| 2021 | $8,040 | $605,900 | $385,100 | $220,800 |
| 2020 | $7,638 | $548,700 | $344,900 | $203,800 |
| 2019 | $7,632 | $548,700 | $344,900 | $203,800 |
| 2018 | $7,450 | $541,400 | $344,900 | $196,500 |
| 2017 | $7,291 | $529,100 | $332,600 | $196,500 |
| 2016 | $7,018 | $484,000 | $285,400 | $198,600 |
| 2015 | $6,926 | $478,000 | $284,300 | $193,700 |
Source: Public Records
Map
Nearby Homes
- 960 Summer St
- 18 Walton St
- 244 Moulton Dr
- 527 Salem St Unit 42
- 320 Pillings Pond Rd
- 3 Garden Ln
- 695 Salem St
- 11 Elizabeth Way
- 344 Broadway
- 3 Suntaug St
- 9 Broadway Unit 305
- 16 Munroe St
- 2 Witham St
- 201 Water St
- 14 Sycamore Rd
- 194 Lake St
- 11 Wilson Ave
- 37 Locust St
- 8 & 14 Sherbrooke Terrace
- 143 Winona St