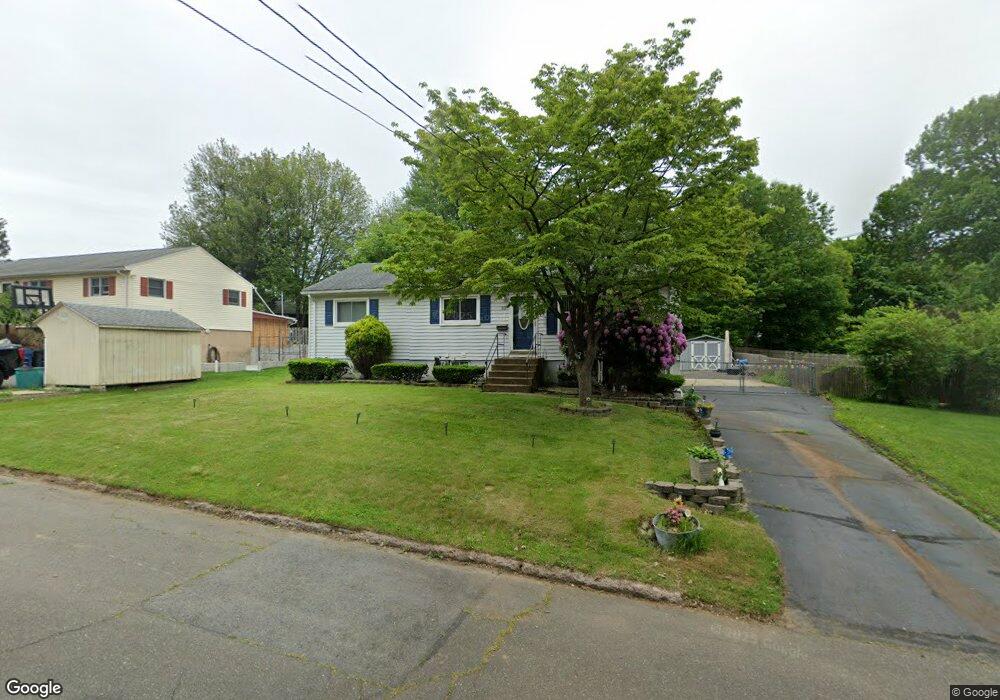
22 Flaum Dr West Haven, CT 06516
West Shore NeighborhoodEstimated Value: $332,000 - $382,000
3
Beds
2
Baths
1,080
Sq Ft
$329/Sq Ft
Est. Value
About This Home
This home is located at 22 Flaum Dr, West Haven, CT 06516 and is currently estimated at $355,754, approximately $329 per square foot. 22 Flaum Dr is a home located in New Haven County with nearby schools including Carrigan 5/6 Intermediate School, Harry M. Bailey Middle School, and West Haven High School.
Ownership History
Date
Name
Owned For
Owner Type
Purchase Details
Closed on
Jul 13, 2022
Sold by
Weiner Christopher J
Bought by
22 Flaum Drive Llc
Current Estimated Value
Purchase Details
Closed on
Oct 11, 2020
Sold by
Ludington Carrol A and Ludington Richard M
Bought by
Weiner Christopher
Create a Home Valuation Report for This Property
The Home Valuation Report is an in-depth analysis detailing your home's value as well as a comparison with similar homes in the area
Home Values in the Area
Average Home Value in this Area
Purchase History
| Date | Buyer | Sale Price | Title Company |
|---|---|---|---|
| 22 Flaum Drive Llc | -- | None Available | |
| 22 Flaum Drive Llc | -- | None Available | |
| Weiner Christopher | $160,000 | None Available | |
| Weiner Christopher | $160,000 | None Available |
Source: Public Records
Tax History Compared to Growth
Tax History
| Year | Tax Paid | Tax Assessment Tax Assessment Total Assessment is a certain percentage of the fair market value that is determined by local assessors to be the total taxable value of land and additions on the property. | Land | Improvement |
|---|---|---|---|---|
| 2025 | $7,289 | $221,760 | $86,520 | $135,240 |
| 2024 | $6,918 | $147,630 | $59,920 | $87,710 |
| 2023 | $6,658 | $147,630 | $59,920 | $87,710 |
| 2022 | $6,539 | $147,630 | $59,920 | $87,710 |
| 2021 | $6,539 | $147,630 | $59,920 | $87,710 |
| 2020 | $6,523 | $134,190 | $55,090 | $79,100 |
| 2019 | $6,315 | $134,190 | $55,090 | $79,100 |
| 2018 | $6,225 | $134,190 | $55,090 | $79,100 |
| 2017 | $6,057 | $134,190 | $55,090 | $79,100 |
| 2016 | $5,990 | $134,190 | $55,090 | $79,100 |
| 2015 | $5,787 | $145,110 | $59,150 | $85,960 |
| 2014 | $5,787 | $145,110 | $59,150 | $85,960 |
Source: Public Records
Map
Nearby Homes