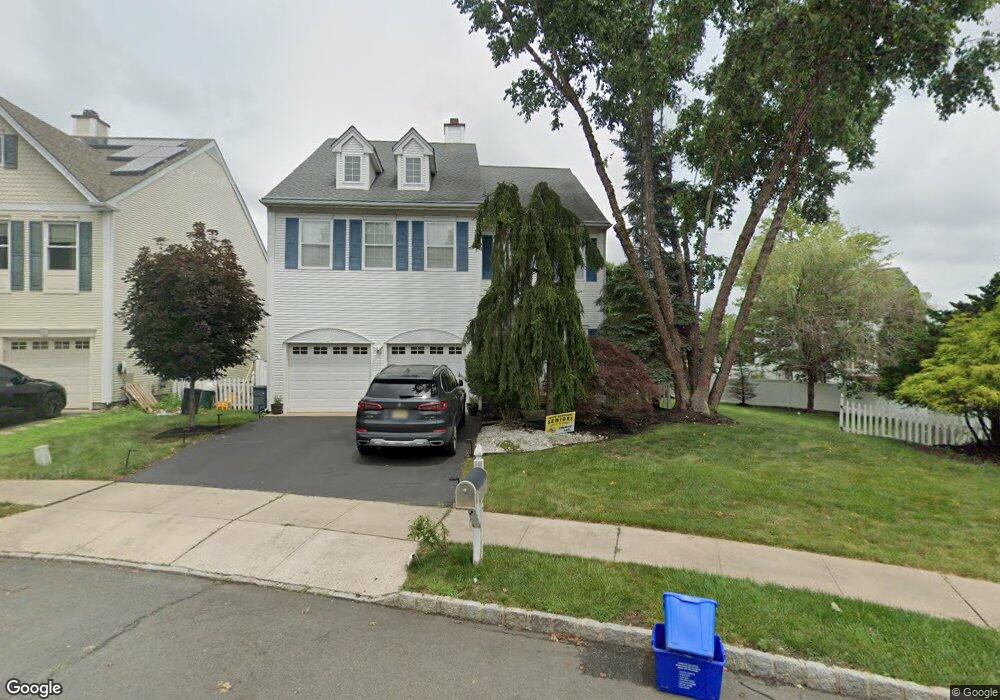
22 Fordham Ct Kendall Park, NJ 08824
Estimated Value: $857,000 - $940,000
4
Beds
3
Baths
2,248
Sq Ft
$398/Sq Ft
Est. Value
About This Home
This home is located at 22 Fordham Ct, Kendall Park, NJ 08824 and is currently estimated at $895,417, approximately $398 per square foot. 22 Fordham Ct is a home located in Middlesex County with nearby schools including Constable Elementary School, Crossroads North Middle School, and South Brunswick High School.
Ownership History
Date
Name
Owned For
Owner Type
Purchase Details
Closed on
Jun 30, 2016
Sold by
Fisher Dwayne and Fisher Ann
Bought by
Laddha Jagdish and Laddha Rakhi
Current Estimated Value
Home Financials for this Owner
Home Financials are based on the most recent Mortgage that was taken out on this home.
Original Mortgage
$512,000
Interest Rate
3.45%
Mortgage Type
New Conventional
Purchase Details
Closed on
Nov 23, 1992
Bought by
Fisher Dwayne and Fisher Ann
Create a Home Valuation Report for This Property
The Home Valuation Report is an in-depth analysis detailing your home's value as well as a comparison with similar homes in the area
Home Values in the Area
Average Home Value in this Area
Purchase History
| Date | Buyer | Sale Price | Title Company |
|---|---|---|---|
| Laddha Jagdish | $570,000 | First American Title | |
| Fisher Dwayne | $224,400 | -- |
Source: Public Records
Mortgage History
| Date | Status | Borrower | Loan Amount |
|---|---|---|---|
| Previous Owner | Laddha Jagdish | $512,000 |
Source: Public Records
Tax History Compared to Growth
Tax History
| Year | Tax Paid | Tax Assessment Tax Assessment Total Assessment is a certain percentage of the fair market value that is determined by local assessors to be the total taxable value of land and additions on the property. | Land | Improvement |
|---|---|---|---|---|
| 2025 | $13,871 | $254,700 | $85,000 | $169,700 |
| 2024 | $13,372 | $254,700 | $85,000 | $169,700 |
Source: Public Records
Map
Nearby Homes