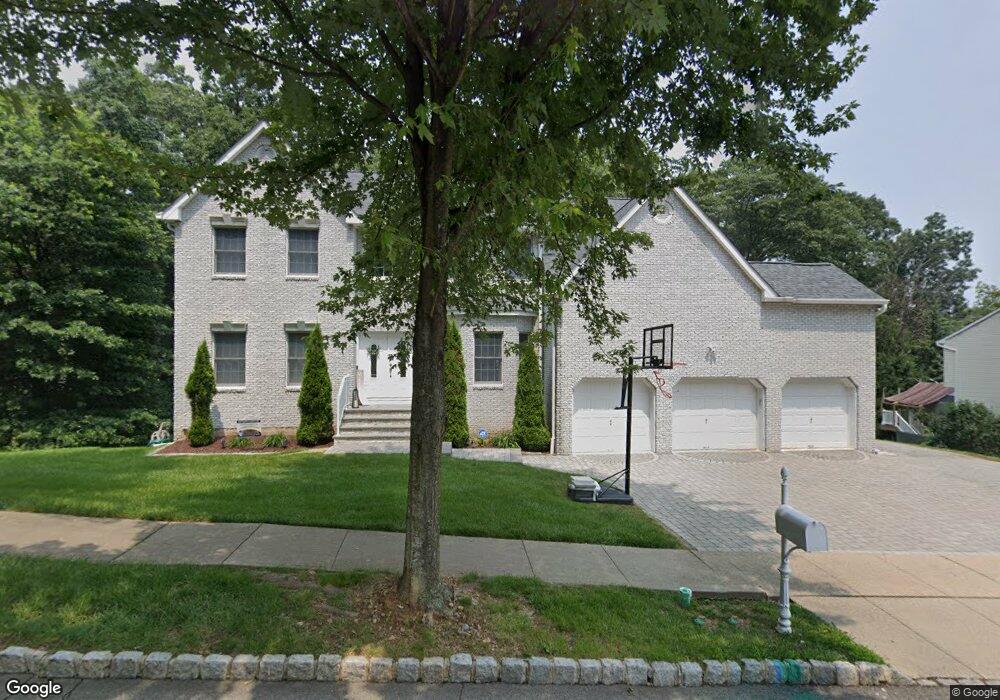
22 Fox Chase Ln Ledgewood, NJ 07852
Estimated Value: $793,000 - $864,000
--
Bed
--
Bath
2,995
Sq Ft
$277/Sq Ft
Est. Value
About This Home
This home is located at 22 Fox Chase Ln, Ledgewood, NJ 07852 and is currently estimated at $829,552, approximately $276 per square foot. 22 Fox Chase Ln is a home located in Morris County with nearby schools including Eisenhower Middle School, Lincoln Roosevelt Elementary School, and Roxbury High School.
Ownership History
Date
Name
Owned For
Owner Type
Purchase Details
Closed on
Mar 31, 2018
Sold by
Patel Jignesh A
Bought by
Patel Yagnesh
Current Estimated Value
Purchase Details
Closed on
Dec 5, 2008
Sold by
Tayam Ronald L and Tayam Liza D
Bought by
Patel Yagnesh and Patel Jignesh A
Home Financials for this Owner
Home Financials are based on the most recent Mortgage that was taken out on this home.
Original Mortgage
$380,000
Interest Rate
6.49%
Mortgage Type
Purchase Money Mortgage
Purchase Details
Closed on
May 24, 2002
Sold by
Hunters Ridge Deve
Bought by
Tayam Ronaldo and Tayam Liza
Home Financials for this Owner
Home Financials are based on the most recent Mortgage that was taken out on this home.
Original Mortgage
$495,000
Interest Rate
6.8%
Create a Home Valuation Report for This Property
The Home Valuation Report is an in-depth analysis detailing your home's value as well as a comparison with similar homes in the area
Home Values in the Area
Average Home Value in this Area
Purchase History
| Date | Buyer | Sale Price | Title Company |
|---|---|---|---|
| Patel Yagnesh | $90,000 | None Available | |
| Patel Yagnesh | $475,000 | Landamerica | |
| Tayam Ronaldo | $568,574 | -- |
Source: Public Records
Mortgage History
| Date | Status | Borrower | Loan Amount |
|---|---|---|---|
| Previous Owner | Patel Yagnesh | $380,000 | |
| Previous Owner | Tayam Ronaldo | $495,000 |
Source: Public Records
Tax History Compared to Growth
Tax History
| Year | Tax Paid | Tax Assessment Tax Assessment Total Assessment is a certain percentage of the fair market value that is determined by local assessors to be the total taxable value of land and additions on the property. | Land | Improvement |
|---|---|---|---|---|
| 2025 | $14,394 | $523,600 | $122,900 | $400,700 |
| 2024 | $14,144 | $523,600 | $122,900 | $400,700 |
| 2023 | $14,144 | $522,700 | $122,900 | $399,800 |
| 2022 | $13,175 | $500,200 | $122,900 | $377,300 |
| 2021 | $13,175 | $500,200 | $122,900 | $377,300 |
| 2020 | $13,150 | $500,200 | $122,900 | $377,300 |
| 2019 | $12,905 | $500,200 | $122,900 | $377,300 |
| 2018 | $14,089 | $326,900 | $87,100 | $239,800 |
| 2017 | $14,014 | $326,900 | $87,100 | $239,800 |
| 2016 | $13,740 | $326,900 | $87,100 | $239,800 |
| 2015 | $13,400 | $326,900 | $87,100 | $239,800 |
| 2014 | $13,187 | $326,900 | $87,100 | $239,800 |
Source: Public Records
Map
Nearby Homes
- 20 Fox Chase Ln
- 21 Fox Chase Ln
- 19 Fox Chase Ln
- 18 Fox Chase Ln
- 15 Long Ridge Ct
- 11 Long Ridge Ct
- 17 Long Ridge Ct
- 17 Fox Chase Ln
- 16 Fox Chase Ln
- 19 Long Ridge Ct
- 29 Fox Chase Ln
- 9 Long Ridge Ct
- 15 Fox Chase Ln
- 14 Fox Chase Ln
- 21 Long Ridge Ct
- 31 Fox Chase Ln
- 12 Long Ridge Ct
- 10 Long Ridge Ct
- 7 Long Ridge Ct
- 75 Fox Chase Ln