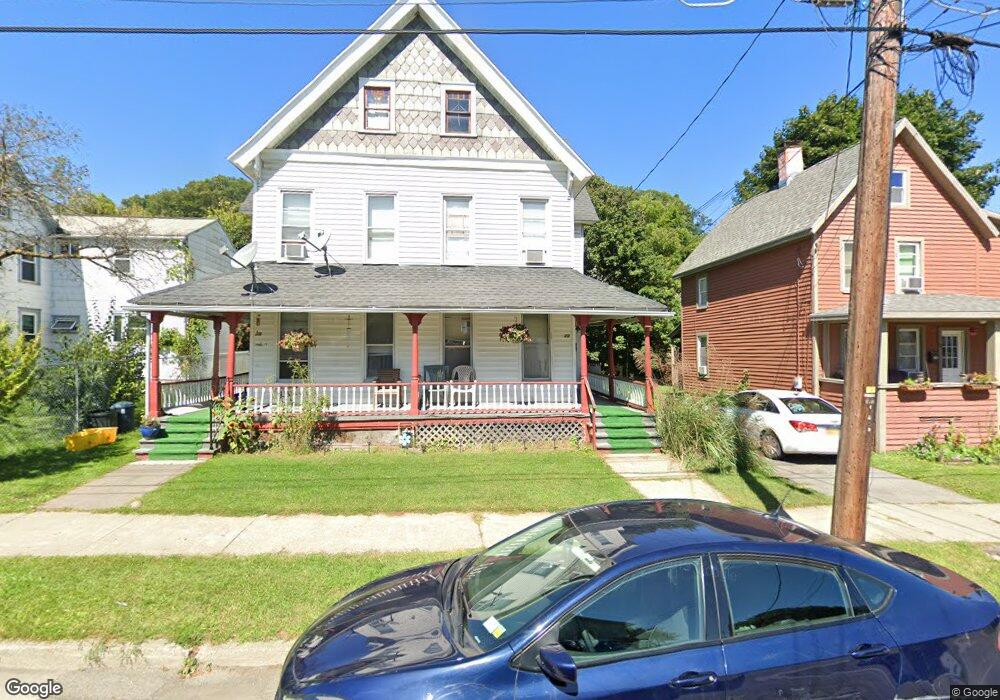
22 Franklin St Unit 24 Binghamton, NY 13905
First Ward NeighborhoodEstimated Value: $83,000 - $152,000
6
Beds
2
Baths
2,272
Sq Ft
$49/Sq Ft
Est. Value
About This Home
This home is located at 22 Franklin St Unit 24, Binghamton, NY 13905 and is currently estimated at $111,804, approximately $49 per square foot. 22 Franklin St Unit 24 is a home located in Broome County with nearby schools including Binghamton High School, Woodrow Wilson Elementary School, and West Middle School.
Ownership History
Date
Name
Owned For
Owner Type
Purchase Details
Closed on
Jun 11, 2015
Sold by
Holmes James
Bought by
Riley Donald and Riley Laurie
Current Estimated Value
Home Financials for this Owner
Home Financials are based on the most recent Mortgage that was taken out on this home.
Original Mortgage
$37,000
Interest Rate
3.97%
Mortgage Type
New Conventional
Purchase Details
Closed on
Apr 18, 2000
Sold by
Davey Richard
Bought by
Holmes James R
Purchase Details
Closed on
Aug 15, 1996
Create a Home Valuation Report for This Property
The Home Valuation Report is an in-depth analysis detailing your home's value as well as a comparison with similar homes in the area
Home Values in the Area
Average Home Value in this Area
Purchase History
| Date | Buyer | Sale Price | Title Company |
|---|---|---|---|
| Riley Donald | $41,000 | None Available | |
| Holmes James R | $38,000 | Doinic De Persis | |
| -- | -- | -- |
Source: Public Records
Mortgage History
| Date | Status | Borrower | Loan Amount |
|---|---|---|---|
| Previous Owner | Riley Donald | $37,000 |
Source: Public Records
Tax History
| Year | Tax Paid | Tax Assessment Tax Assessment Total Assessment is a certain percentage of the fair market value that is determined by local assessors to be the total taxable value of land and additions on the property. | Land | Improvement |
|---|---|---|---|---|
| 2024 | $4,928 | $50,000 | $7,100 | $42,900 |
| 2023 | $4,838 | $50,000 | $7,100 | $42,900 |
| 2022 | $4,724 | $50,000 | $7,100 | $42,900 |
| 2021 | $4,671 | $50,000 | $7,100 | $42,900 |
| 2020 | $3,089 | $50,000 | $7,100 | $42,900 |
| 2019 | $1,577 | $50,000 | $7,100 | $42,900 |
| 2018 | $3,012 | $50,000 | $7,100 | $42,900 |
| 2017 | $3,027 | $50,000 | $7,100 | $42,900 |
| 2016 | $3,040 | $50,000 | $7,100 | $42,900 |
| 2015 | $2,700 | $50,000 | $7,100 | $42,900 |
| 2014 | $2,700 | $50,000 | $7,100 | $42,900 |
Source: Public Records
Map
Nearby Homes
Your Personal Tour Guide
Ask me questions while you tour the home.