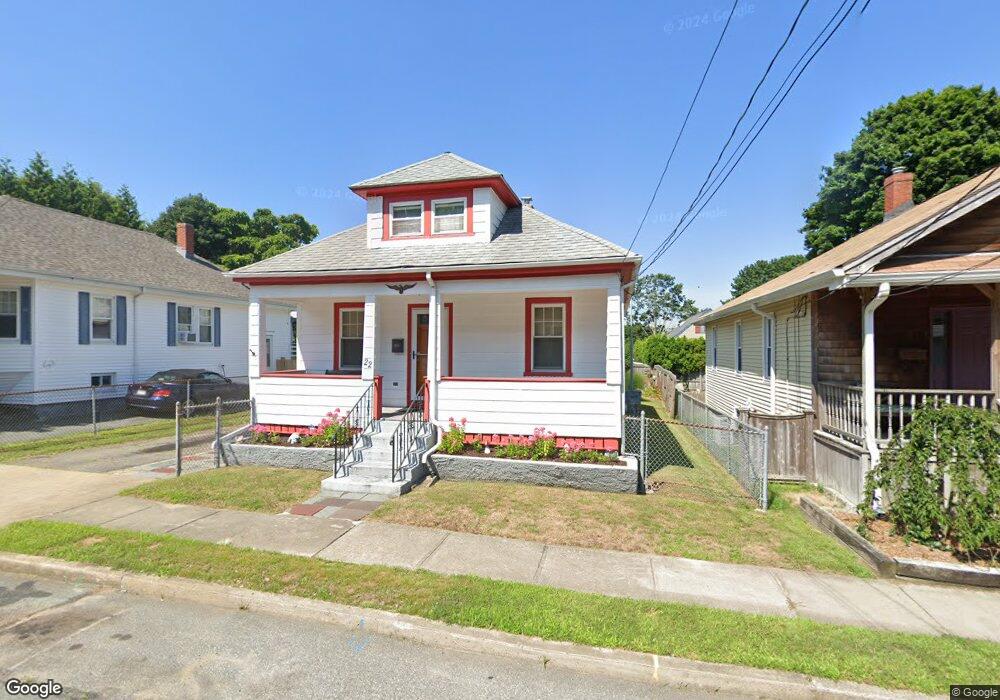
22 Garrison St Fairhaven, MA 02719
North Fairhaven NeighborhoodEstimated Value: $400,000 - $423,789
3
Beds
1
Bath
1,382
Sq Ft
$297/Sq Ft
Est. Value
About This Home
This home is located at 22 Garrison St, Fairhaven, MA 02719 and is currently estimated at $410,197, approximately $296 per square foot. 22 Garrison St is a home located in Bristol County with nearby schools including Fairhaven High School, Alma Del Mar Charter School, and St. Joseph School.
Ownership History
Date
Name
Owned For
Owner Type
Purchase Details
Closed on
Jun 27, 2008
Sold by
Beneficial Mass Inc
Bought by
Barbosa John M
Current Estimated Value
Home Financials for this Owner
Home Financials are based on the most recent Mortgage that was taken out on this home.
Original Mortgage
$104,900
Outstanding Balance
$66,500
Interest Rate
6.07%
Mortgage Type
Purchase Money Mortgage
Estimated Equity
$343,697
Purchase Details
Closed on
Feb 29, 2008
Sold by
Rosa Erin E and Serpa Kristin L
Bought by
Beneficial Mass Inc
Purchase Details
Closed on
Jun 20, 2007
Sold by
Carreiro Victor M
Bought by
Rosa Erin E and Serpa Kristin L
Create a Home Valuation Report for This Property
The Home Valuation Report is an in-depth analysis detailing your home's value as well as a comparison with similar homes in the area
Home Values in the Area
Average Home Value in this Area
Purchase History
| Date | Buyer | Sale Price | Title Company |
|---|---|---|---|
| Barbosa John M | $179,900 | -- | |
| Beneficial Mass Inc | $295,074 | -- | |
| Rosa Erin E | -- | -- |
Source: Public Records
Mortgage History
| Date | Status | Borrower | Loan Amount |
|---|---|---|---|
| Open | Rosa Erin E | $104,900 |
Source: Public Records
Tax History
| Year | Tax Paid | Tax Assessment Tax Assessment Total Assessment is a certain percentage of the fair market value that is determined by local assessors to be the total taxable value of land and additions on the property. | Land | Improvement |
|---|---|---|---|---|
| 2025 | $29 | $313,200 | $169,300 | $143,900 |
| 2024 | $2,979 | $322,700 | $169,300 | $153,400 |
| 2023 | $2,909 | $292,400 | $148,300 | $144,100 |
| 2022 | $2,821 | $276,000 | $137,800 | $138,200 |
| 2021 | $2,678 | $237,200 | $124,700 | $112,500 |
| 2020 | $2,623 | $237,200 | $124,700 | $112,500 |
| 2019 | $2,417 | $207,100 | $103,400 | $103,700 |
| 2018 | $2,345 | $197,700 | $98,400 | $99,300 |
| 2017 | $2,306 | $191,500 | $98,400 | $93,100 |
| 2016 | $2,239 | $183,800 | $98,400 | $85,400 |
| 2015 | $2,216 | $182,400 | $98,400 | $84,000 |
Source: Public Records
Map
Nearby Homes
- 20 Garrison St
- 24 Garrison St
- 18 Garrison St
- 14 Garrison St
- 21 Sycamore St
- 26 Garrison St
- 19 Sycamore St
- 23 Sycamore St
- 16 Garrison St
- 25 Sycamore St
- 21 Garrison St
- 28 Garrison St
- 17 Sycamore St
- 17 Sycamore St
- 23 Garrison St
- 17 Garrison St
- 25 Garrison St
- 27 Sycamore St
- 30 Garrison St
- 30 Garrison St Unit 1
Your Personal Tour Guide
Ask me questions while you tour the home.