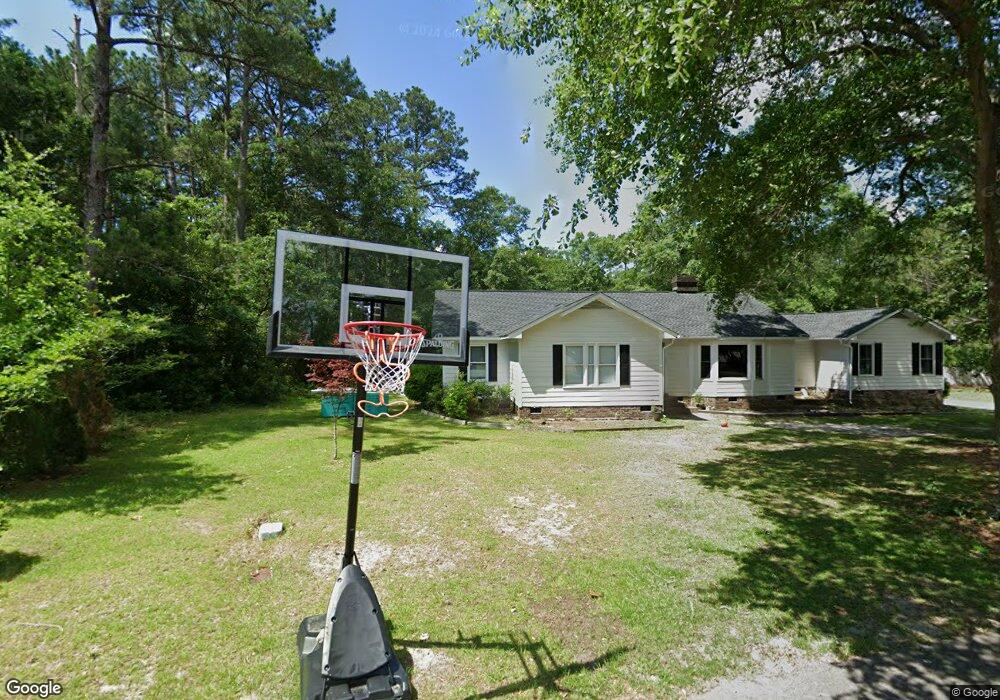
22 Gazebo Ct Camden, SC 29020
Estimated Value: $271,000 - $346,000
--
Bed
--
Bath
2,912
Sq Ft
$105/Sq Ft
Est. Value
About This Home
This home is located at 22 Gazebo Ct, Camden, SC 29020 and is currently estimated at $306,109, approximately $105 per square foot. 22 Gazebo Ct is a home located in Kershaw County with nearby schools including Camden Elementary of the Creative Arts, Pine Tree Hill Elementary School, and Camden Middle School.
Ownership History
Date
Name
Owned For
Owner Type
Purchase Details
Closed on
Apr 23, 2021
Sold by
Holden Boykin Chelsey M
Bought by
Bratsos Shan D and Bratsos Mary H
Current Estimated Value
Home Financials for this Owner
Home Financials are based on the most recent Mortgage that was taken out on this home.
Original Mortgage
$196,377
Outstanding Balance
$177,064
Interest Rate
3.05%
Mortgage Type
FHA
Estimated Equity
$129,045
Purchase Details
Closed on
Apr 22, 2021
Sold by
Holden Boykin Chelsey M
Bought by
Bratsos Shan D and Bratsos Mary H
Home Financials for this Owner
Home Financials are based on the most recent Mortgage that was taken out on this home.
Original Mortgage
$196,377
Outstanding Balance
$177,064
Interest Rate
3.05%
Mortgage Type
FHA
Estimated Equity
$129,045
Purchase Details
Closed on
Jun 16, 2000
Sold by
Sheheen Debra S
Bought by
Donnelly Samuel and Donnelly Jean
Create a Home Valuation Report for This Property
The Home Valuation Report is an in-depth analysis detailing your home's value as well as a comparison with similar homes in the area
Home Values in the Area
Average Home Value in this Area
Purchase History
| Date | Buyer | Sale Price | Title Company |
|---|---|---|---|
| Bratsos Shan D | $200,000 | Conder Anne S | |
| Bratsos Shan D | $200,000 | Conder Anne S | |
| Donnelly Samuel | $156,000 | -- |
Source: Public Records
Mortgage History
| Date | Status | Borrower | Loan Amount |
|---|---|---|---|
| Open | Bratsos Shan D | $196,377 | |
| Closed | Bratsos Shan D | $196,377 |
Source: Public Records
Tax History Compared to Growth
Tax History
| Year | Tax Paid | Tax Assessment Tax Assessment Total Assessment is a certain percentage of the fair market value that is determined by local assessors to be the total taxable value of land and additions on the property. | Land | Improvement |
|---|---|---|---|---|
| 2025 | $1,485 | $200,000 | $35,000 | $165,000 |
| 2024 | $1,485 | $200,000 | $35,000 | $165,000 |
| 2023 | $573 | $200,000 | $35,000 | $165,000 |
| 2022 | $1,241 | $200,000 | $35,000 | $165,000 |
| 2021 | $996 | $200,000 | $35,000 | $165,000 |
| 2020 | $1,041 | $161,900 | $20,000 | $141,900 |
| 2019 | $1,075 | $161,900 | $20,000 | $141,900 |
| 2018 | $1,086 | $161,900 | $20,000 | $141,900 |
| 2017 | $3,396 | $161,900 | $20,000 | $141,900 |
| 2016 | $733 | $162,600 | $20,000 | $142,600 |
| 2015 | $516 | $162,600 | $20,000 | $142,600 |
| 2014 | $516 | $6,504 | $0 | $0 |
Source: Public Records
Map
Nearby Homes
- 25 Gazebo Ct
- 20 Hunt Cup Ln
- 59 Edinburgh Castle Ln
- 15 Bomburgh Rd
- 25 Crickle Creek Ln
- 51 Edinburgh Castle Ln
- 4 Lydford Ln
- 55 Edinburgh Ln
- 904 Sunnyhill Dr
- 518 Saddle Dr
- 41 Carlisle Ln
- 37 Parkwood Ct
- 101 Parkwood Ct
- 210 Carriagebrook Cir
- 71 Brayden Way
- 403 Revere Cir
- 2224 Carter St Unit Tract C
- 102 Gates Ct
- 2108 Broad St Unit 23
- 314 Kirkwood Ln