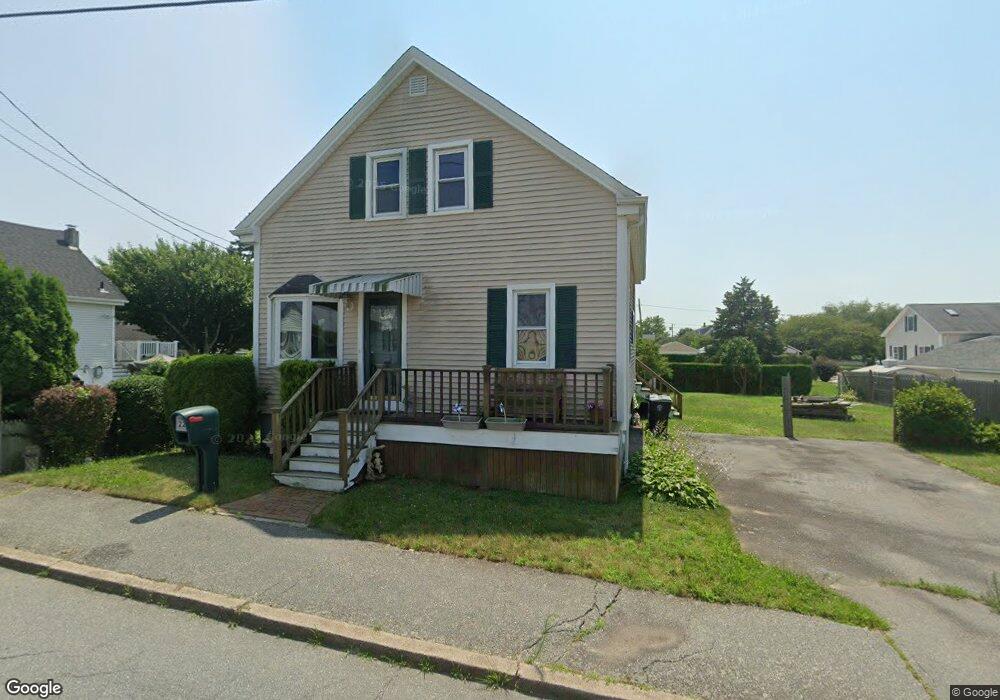
22 Gorham St South Dartmouth, MA 02748
Bliss Corner NeighborhoodEstimated Value: $330,000 - $412,118
2
Beds
1
Bath
1,237
Sq Ft
$299/Sq Ft
Est. Value
About This Home
This home is located at 22 Gorham St, South Dartmouth, MA 02748 and is currently estimated at $369,530, approximately $298 per square foot. 22 Gorham St is a home located in Bristol County with nearby schools including Dartmouth High School and St. Teresa of Calcutta School.
Ownership History
Date
Name
Owned For
Owner Type
Purchase Details
Closed on
Jun 13, 2025
Sold by
Aguiar Danielle and Martin Derek M
Bought by
Farland Christine I
Current Estimated Value
Home Financials for this Owner
Home Financials are based on the most recent Mortgage that was taken out on this home.
Original Mortgage
$340,714
Outstanding Balance
$339,234
Interest Rate
6.76%
Mortgage Type
FHA
Estimated Equity
$30,296
Purchase Details
Closed on
Sep 6, 2024
Sold by
Bramwell Rose A Est and Bramwell
Bought by
Aguiar Danielle and Martin Dereck M
Create a Home Valuation Report for This Property
The Home Valuation Report is an in-depth analysis detailing your home's value as well as a comparison with similar homes in the area
Home Values in the Area
Average Home Value in this Area
Purchase History
| Date | Buyer | Sale Price | Title Company |
|---|---|---|---|
| Farland Christine I | $347,000 | None Available | |
| Farland Christine I | $347,000 | None Available | |
| Farland Christine I | $347,000 | None Available | |
| Aguiar Danielle | -- | None Available | |
| Aguiar Danielle | -- | None Available | |
| Aguiar Danielle | -- | None Available |
Source: Public Records
Mortgage History
| Date | Status | Borrower | Loan Amount |
|---|---|---|---|
| Open | Farland Christine I | $340,714 | |
| Closed | Farland Christine I | $340,714 |
Source: Public Records
Tax History Compared to Growth
Tax History
| Year | Tax Paid | Tax Assessment Tax Assessment Total Assessment is a certain percentage of the fair market value that is determined by local assessors to be the total taxable value of land and additions on the property. | Land | Improvement |
|---|---|---|---|---|
| 2025 | $2,635 | $306,000 | $119,300 | $186,700 |
| 2024 | $2,515 | $289,400 | $119,300 | $170,100 |
| 2023 | $2,488 | $271,300 | $119,300 | $152,000 |
| 2022 | $2,444 | $246,900 | $119,300 | $127,600 |
| 2021 | $2,213 | $213,600 | $115,800 | $97,800 |
| 2020 | $2,134 | $205,600 | $114,700 | $90,900 |
| 2019 | $2,106 | $202,500 | $110,000 | $92,500 |
| 2018 | $2,066 | $195,700 | $112,400 | $83,300 |
| 2017 | $1,862 | $185,800 | $103,800 | $82,000 |
| 2016 | $1,723 | $169,600 | $91,800 | $77,800 |
| 2015 | $1,672 | $164,900 | $85,800 | $79,100 |
| 2014 | $1,643 | $160,900 | $83,400 | $77,500 |
Source: Public Records
Map
Nearby Homes