
Landlord's Agent in 2018
Patti Brainard
Compass
(781) 789-5767
8 in this area
144 Total Sales
Estimated Value: $1,664,000 - $2,000,170
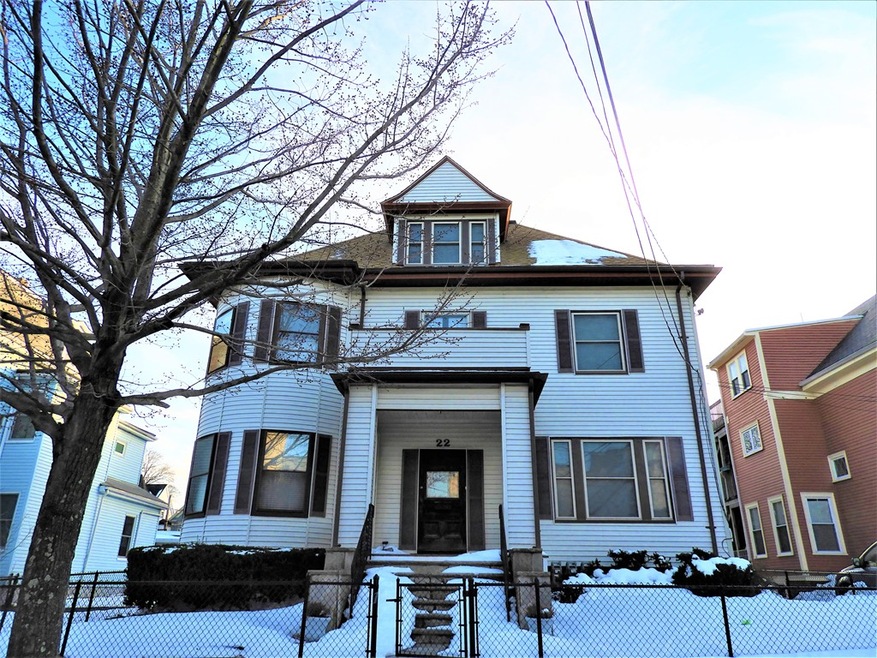
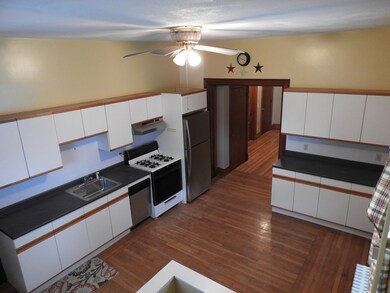
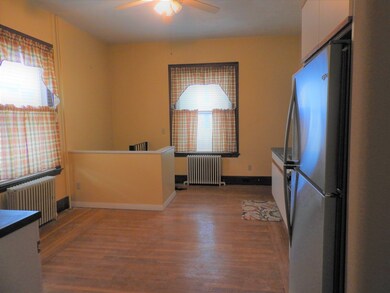
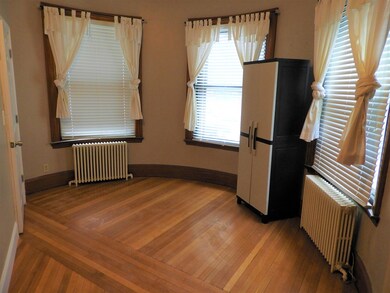
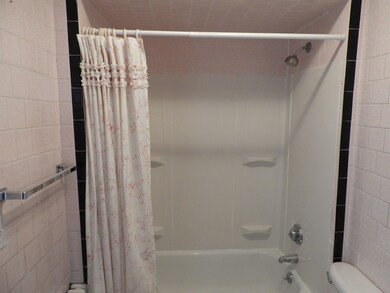
Don't miss this charming 3 Bed available in a multi-family home. This newly renovated unit comes fully outfitted with brand new cabinetry and kitchen appliances including a new stainless steel fridge and new dishwasher. This unit is available steps from the historic and lively Union square shopping center; Where you have access to explore the rest of Cambridge and Sommerville. Public transit available to MIT and Kendall Sq (bus line 85), Harvard Sq and Sullivan station (bus line 86), Lechmere and Davis train stations (Bus line 87, 88 & Bus line 90, station within one block), And easy access to I-93 to downtown Boston. Electricity included! Price of $2100 per month will raise to 2400 per month starting 9/1/18. Term of lease is up to 17 months, Short-term is OK ending 8/31/18.
Last Renter's Agent
Ricky Everest
Compass License #449591986
| Date | Buyer | Sale Price | Title Company |
|---|---|---|---|
| He Wei | $1,210,000 | -- | |
| Pinkham Edwin W | $24,000 | -- |
| Date | Status | Borrower | Loan Amount |
|---|---|---|---|
| Open | He Wei | $907,500 | |
| Closed | Pinkham Edwin W | $907,500 | |
| Previous Owner | Pinkham Edwin W | $100,000 | |
| Previous Owner | Pinkham Edwin W | $22,000 |
| Date | Event | Price | List to Sale | Price per Sq Ft | Prior Sale |
|---|---|---|---|---|---|
| 05/01/2018 05/01/18 | Rented | $2,400 | 0.0% | -- | |
| 05/01/2018 05/01/18 | Rented | $2,400 | +14.3% | -- | |
| 04/23/2018 04/23/18 | Under Contract | -- | -- | -- | |
| 04/17/2018 04/17/18 | Price Changed | $2,100 | -12.5% | $0 / Sq Ft | |
| 04/10/2018 04/10/18 | Under Contract | -- | -- | -- | |
| 04/01/2018 04/01/18 | For Rent | $2,400 | 0.0% | -- | |
| 03/17/2018 03/17/18 | Price Changed | $2,400 | -4.0% | $2 / Sq Ft | |
| 03/17/2018 03/17/18 | For Rent | $2,500 | +56.3% | -- | |
| 02/02/2018 02/02/18 | Rented | $1,600 | 0.0% | -- | |
| 01/09/2018 01/09/18 | For Rent | $1,600 | 0.0% | -- | |
| 12/11/2017 12/11/17 | Sold | $1,210,000 | +0.8% | $325 / Sq Ft | View Prior Sale |
| 10/18/2017 10/18/17 | Pending | -- | -- | -- | |
| 09/22/2017 09/22/17 | For Sale | $1,200,000 | -- | $322 / Sq Ft |
| Year | Tax Paid | Tax Assessment Tax Assessment Total Assessment is a certain percentage of the fair market value that is determined by local assessors to be the total taxable value of land and additions on the property. | Land | Improvement |
|---|---|---|---|---|
| 2025 | $15,468 | $1,417,800 | $664,200 | $753,600 |
| 2024 | $14,574 | $1,385,400 | $664,200 | $721,200 |
| 2023 | $14,258 | $1,378,900 | $664,200 | $714,700 |
| 2022 | $13,583 | $1,334,300 | $632,600 | $701,700 |
| 2021 | $12,594 | $1,235,900 | $602,400 | $633,500 |
| 2020 | $11,810 | $1,170,500 | $579,200 | $591,300 |
| 2019 | $10,910 | $1,013,900 | $503,700 | $510,200 |
| 2018 | $10,039 | $887,600 | $457,900 | $429,700 |
| 2017 | $9,904 | $848,700 | $432,000 | $416,700 |
| 2016 | $9,880 | $788,500 | $395,000 | $393,500 |
| 2015 | $9,793 | $776,600 | $392,900 | $383,700 |
Landlord's Agent in 2018
Patti Brainard
Compass
(781) 789-5767
8 in this area
144 Total Sales
D
Seller's Agent in 2018
David-Daili Xiao
Engel & Volkers Newton
(857) 297-2000
27 Total Sales
R
Tenant's Agent in 2018
Ricky Everest
Compass
Buyer's Agent in 2018
katie crabtree
Keller Williams Coastal
(617) 777-5384
14 Total Sales
Seller's Agent in 2017
The iBremis Team
Laer Realty
(617) 905-5232
18 Total Sales
Source: MLS Property Information Network (MLS PIN)
MLS Number: 72301168
APN: SOME-000072-E000000-000002
Disclaimer: Certain information contained herein is derived from information provided by parties other than Homes.com. All information provided is deemed reliable, but is not guaranteed to be accurate and should be independently verified.
![]() The property listing data and information, or the Images, set forth herein were provided to MLS Property Information Network, Inc. from third party sources, including sellers, lessors and public records, and were compiled by MLS Property Information Network, Inc. The property listing data and information, and the Images, are for the personal, non-commercial use of consumers having a good faith interest in purchasing or leasing listed properties of the type displayed to them and may not be used for any purpose other than to identify prospective properties which such consumers may have a good faith interest in purchasing or leasing. MLS Property Information Network, Inc. and its subscribers disclaim any and all representations and warranties as to the accuracy of the property listing data and information, or as to the accuracy of any of the Images, set forth herein.
The property listing data and information, or the Images, set forth herein were provided to MLS Property Information Network, Inc. from third party sources, including sellers, lessors and public records, and were compiled by MLS Property Information Network, Inc. The property listing data and information, and the Images, are for the personal, non-commercial use of consumers having a good faith interest in purchasing or leasing listed properties of the type displayed to them and may not be used for any purpose other than to identify prospective properties which such consumers may have a good faith interest in purchasing or leasing. MLS Property Information Network, Inc. and its subscribers disclaim any and all representations and warranties as to the accuracy of the property listing data and information, or as to the accuracy of any of the Images, set forth herein.
Ask me questions while you tour the home.