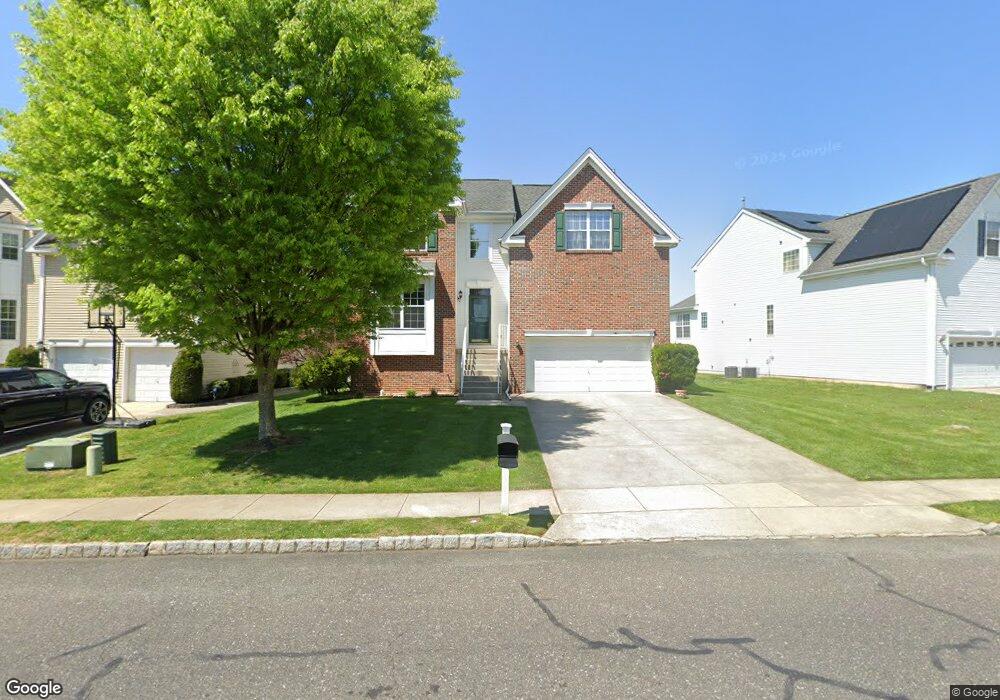
22 Grande Blvd Delran, NJ 08075
Estimated Value: $580,000 - $630,000
4
Beds
3
Baths
2,386
Sq Ft
$253/Sq Ft
Est. Value
About This Home
This home is located at 22 Grande Blvd, Delran, NJ 08075 and is currently estimated at $602,996, approximately $252 per square foot. 22 Grande Blvd is a home located in Burlington County with nearby schools including Millbridge Elementary School, Delran Intermediate School, and Delran Middle School.
Ownership History
Date
Name
Owned For
Owner Type
Purchase Details
Closed on
Jun 14, 2021
Sold by
Cmh Properties Llc
Bought by
Nvr Inc
Current Estimated Value
Purchase Details
Closed on
Apr 22, 2010
Sold by
Chauhan Manoj K and Chauhan Mahima
Bought by
Patel Jignesh and Patel Prital
Home Financials for this Owner
Home Financials are based on the most recent Mortgage that was taken out on this home.
Original Mortgage
$200,000
Interest Rate
4.57%
Mortgage Type
New Conventional
Purchase Details
Closed on
Apr 22, 2004
Sold by
D R Horton Inc New Jersey
Bought by
Chauhan Manoj K and Chauhan Mahima
Home Financials for this Owner
Home Financials are based on the most recent Mortgage that was taken out on this home.
Original Mortgage
$175,000
Interest Rate
4.67%
Mortgage Type
Purchase Money Mortgage
Create a Home Valuation Report for This Property
The Home Valuation Report is an in-depth analysis detailing your home's value as well as a comparison with similar homes in the area
Home Values in the Area
Average Home Value in this Area
Purchase History
| Date | Buyer | Sale Price | Title Company |
|---|---|---|---|
| Nvr Inc | $106,000 | Title America Agency Corp | |
| Patel Jignesh | $370,000 | First American Title Ins Co | |
| Chauhan Manoj K | $283,090 | Infinity Title Agency Inc |
Source: Public Records
Mortgage History
| Date | Status | Borrower | Loan Amount |
|---|---|---|---|
| Previous Owner | Patel Jignesh | $200,000 | |
| Previous Owner | Chauhan Manoj K | $175,000 |
Source: Public Records
Tax History Compared to Growth
Tax History
| Year | Tax Paid | Tax Assessment Tax Assessment Total Assessment is a certain percentage of the fair market value that is determined by local assessors to be the total taxable value of land and additions on the property. | Land | Improvement |
|---|---|---|---|---|
| 2025 | $12,262 | $308,400 | $56,000 | $252,400 |
| 2024 | $12,151 | $308,400 | $56,000 | $252,400 |
| 2023 | $12,151 | $308,400 | $56,000 | $252,400 |
| 2022 | $11,994 | $308,400 | $56,000 | $252,400 |
| 2021 | $12,000 | $308,400 | $56,000 | $252,400 |
| 2020 | $11,975 | $308,400 | $56,000 | $252,400 |
| 2019 | $11,864 | $308,400 | $56,000 | $252,400 |
| 2018 | $11,667 | $308,400 | $56,000 | $252,400 |
| 2017 | $11,251 | $302,200 | $56,000 | $246,200 |
| 2016 | $11,085 | $302,200 | $56,000 | $246,200 |
| 2015 | $10,900 | $302,200 | $56,000 | $246,200 |
| 2014 | $10,426 | $302,200 | $56,000 | $246,200 |
Source: Public Records
Map
Nearby Homes
- 3 Dewberry Ln
- 342 Huntington Dr Unit 342
- 19 Foxglove Dr Unit 19
- 8 Woodrush Ct
- 34 Foxglove Dr Unit 34
- 3 Teaberry Ln
- 144 Natalie Rd
- 148 Natalie Rd Unit 148
- 85 Foxglove Dr Unit 85
- 1 Weatherly Rd
- 3 Firethorn Ln
- 142 Rosebay Ct Unit 142
- 265 Rosebay Ct Unit 265
- 27 Firethorn Ln
- 22 Sun Haven Place
- 0 0 Swarthmore Dr
- 6 Sylvan Ct
- 53 Hartford Rd
- 751 Garwood Rd
- 7016 Route 130
- 24 Grande Blvd
- 30 Grande Blvd
- 2 Buckingham Ct
- 4 Buckingham Ct
- 26 Grande Blvd
- 33 Grande Blvd
- 27 Grande Blvd
- 29 Grande Blvd
- 31 Grande Blvd
- 25 Grande Blvd
- 6 Buckingham Ct
- 1 Buckingham Ct
- 23 Grande Blvd
- 21 Grande Blvd
- 8 Buckingham Ct
- 3 Buckingham Ct
- 21 Providence Ct
- 19 Grande Blvd
- 10 Buckingham Ct
- 23 Providence Ct