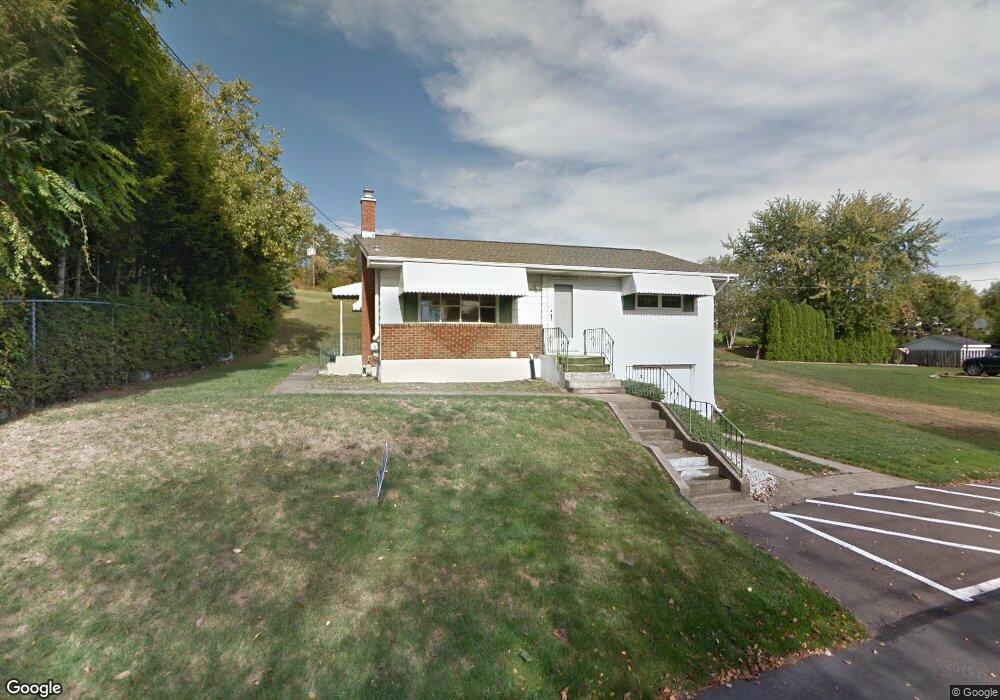
22 Halliday Ct Hanover Township, PA 18706
Estimated Value: $164,000 - $205,000
3
Beds
1
Bath
1,015
Sq Ft
$178/Sq Ft
Est. Value
About This Home
This home is located at 22 Halliday Ct, Hanover Township, PA 18706 and is currently estimated at $180,455, approximately $177 per square foot. 22 Halliday Ct is a home located in Luzerne County with nearby schools including Lee Park Elementary School, Hanover Area Memorial Elementary School, and Hanover Green Elementary School.
Ownership History
Date
Name
Owned For
Owner Type
Purchase Details
Closed on
Nov 18, 2015
Sold by
Amendola Joseph J
Bought by
Benning David Frederick
Current Estimated Value
Home Financials for this Owner
Home Financials are based on the most recent Mortgage that was taken out on this home.
Original Mortgage
$89,351
Outstanding Balance
$71,358
Interest Rate
4.25%
Mortgage Type
FHA
Estimated Equity
$109,097
Purchase Details
Closed on
Jun 26, 2002
Bought by
Amendola Joseph J
Create a Home Valuation Report for This Property
The Home Valuation Report is an in-depth analysis detailing your home's value as well as a comparison with similar homes in the area
Home Values in the Area
Average Home Value in this Area
Purchase History
| Date | Buyer | Sale Price | Title Company |
|---|---|---|---|
| Benning David Frederick | $91,000 | First American Title Ins Co | |
| Amendola Joseph J | -- | None Available | |
| Amendola Joseph J | $75,000 | -- |
Source: Public Records
Mortgage History
| Date | Status | Borrower | Loan Amount |
|---|---|---|---|
| Open | Benning David Frederick | $89,351 |
Source: Public Records
Tax History Compared to Growth
Tax History
| Year | Tax Paid | Tax Assessment Tax Assessment Total Assessment is a certain percentage of the fair market value that is determined by local assessors to be the total taxable value of land and additions on the property. | Land | Improvement |
|---|---|---|---|---|
| 2025 | $2,744 | $89,600 | $30,900 | $58,700 |
| 2024 | $2,744 | $89,600 | $30,900 | $58,700 |
| 2023 | $2,744 | $89,600 | $30,900 | $58,700 |
| 2022 | $2,728 | $89,600 | $30,900 | $58,700 |
| 2021 | $2,728 | $89,600 | $30,900 | $58,700 |
| 2020 | $2,728 | $89,600 | $30,900 | $58,700 |
| 2019 | $2,657 | $89,600 | $30,900 | $58,700 |
| 2018 | $2,603 | $89,600 | $30,900 | $58,700 |
| 2017 | $2,603 | $89,600 | $30,900 | $58,700 |
| 2016 | -- | $89,600 | $30,900 | $58,700 |
| 2015 | $2,097 | $86,600 | $27,900 | $58,700 |
| 2014 | $2,097 | $86,600 | $27,900 | $58,700 |
Source: Public Records
Map
Nearby Homes