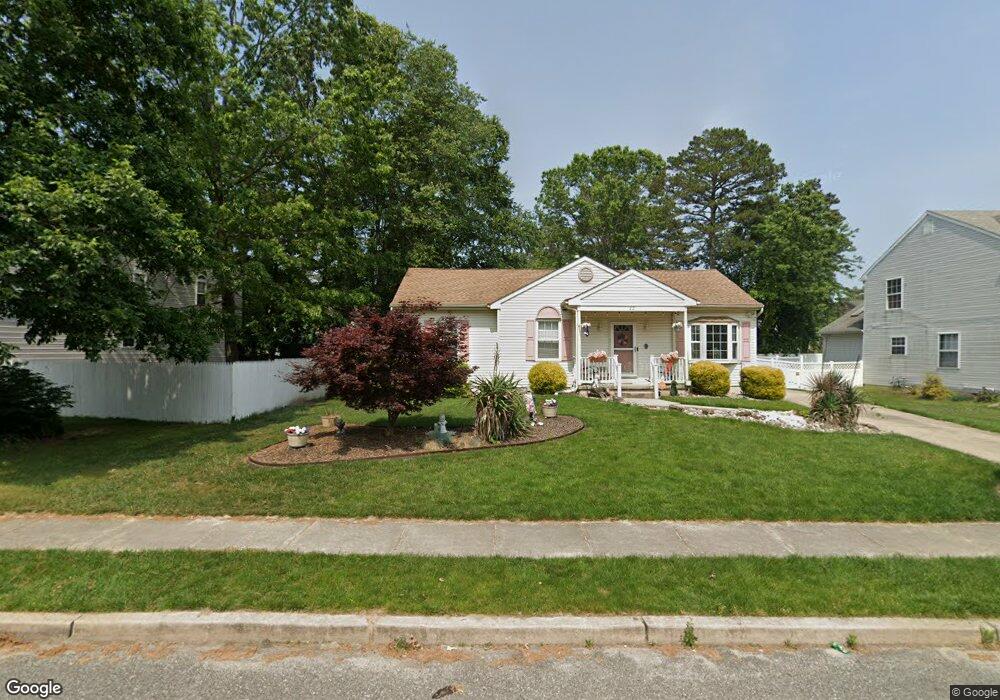
22 Hancock Ln Berlin, NJ 08009
Estimated Value: $321,284 - $353,000
--
Bed
--
Bath
1,077
Sq Ft
$311/Sq Ft
Est. Value
About This Home
This home is located at 22 Hancock Ln, Berlin, NJ 08009 and is currently estimated at $335,321, approximately $311 per square foot. 22 Hancock Ln is a home located in Camden County with nearby schools including John Glenn Elementary School, Pine Hill Middle School, and Cambridge High School.
Ownership History
Date
Name
Owned For
Owner Type
Purchase Details
Closed on
Jul 21, 2006
Sold by
Stevenson Cassandra A
Bought by
Fisher Christina
Current Estimated Value
Home Financials for this Owner
Home Financials are based on the most recent Mortgage that was taken out on this home.
Original Mortgage
$96,500
Outstanding Balance
$57,448
Interest Rate
6.7%
Estimated Equity
$277,873
Purchase Details
Closed on
Oct 19, 2004
Sold by
Petersen Craig C
Bought by
Stevenson Cassandra A
Home Financials for this Owner
Home Financials are based on the most recent Mortgage that was taken out on this home.
Original Mortgage
$144,000
Interest Rate
5.71%
Purchase Details
Closed on
Apr 30, 1997
Sold by
Wilburn Garry A
Bought by
Petersen Craig C and Peterson Kimberly A
Home Financials for this Owner
Home Financials are based on the most recent Mortgage that was taken out on this home.
Original Mortgage
$114,000
Interest Rate
7.7%
Mortgage Type
FHA
Create a Home Valuation Report for This Property
The Home Valuation Report is an in-depth analysis detailing your home's value as well as a comparison with similar homes in the area
Home Values in the Area
Average Home Value in this Area
Purchase History
| Date | Buyer | Sale Price | Title Company |
|---|---|---|---|
| Fisher Christina | $223,500 | -- | |
| Stevenson Cassandra A | $193,000 | -- | |
| Petersen Craig C | $113,900 | -- |
Source: Public Records
Mortgage History
| Date | Status | Borrower | Loan Amount |
|---|---|---|---|
| Open | Fisher Christina | $96,500 | |
| Previous Owner | Stevenson Cassandra A | $144,000 | |
| Previous Owner | Petersen Craig C | $114,000 |
Source: Public Records
Tax History Compared to Growth
Tax History
| Year | Tax Paid | Tax Assessment Tax Assessment Total Assessment is a certain percentage of the fair market value that is determined by local assessors to be the total taxable value of land and additions on the property. | Land | Improvement |
|---|---|---|---|---|
| 2025 | $7,830 | $138,900 | $27,600 | $111,300 |
| 2024 | $7,559 | $138,900 | $27,600 | $111,300 |
| 2023 | $7,559 | $138,900 | $27,600 | $111,300 |
| 2022 | $7,342 | $138,900 | $27,600 | $111,300 |
| 2021 | $7,492 | $138,900 | $27,600 | $111,300 |
| 2020 | $7,341 | $138,900 | $27,600 | $111,300 |
| 2019 | $1,081 | $138,900 | $27,600 | $111,300 |
| 2018 | $7,549 | $138,900 | $27,600 | $111,300 |
| 2017 | $7,388 | $138,900 | $27,600 | $111,300 |
| 2016 | $7,479 | $177,400 | $52,600 | $124,800 |
| 2015 | $7,273 | $177,400 | $52,600 | $124,800 |
| 2014 | $7,064 | $177,400 | $52,600 | $124,800 |
Source: Public Records
Map
Nearby Homes
- 28 Grand Ave
- 1091 Grandview Dr
- 13 Ford Ln
- 5 Ford Ln
- 15 Kresson Ct
- 93 Grant Ln
- 4 Woodcrest Ct
- 277 Berlin - Cross Keys Rd
- 271 Berlin - Cross Keys Rd
- 271-277 Berlin - Cross Keys Rd
- 243 Bittlewood Ave
- 50 Loft Mountain Dr
- 21 Loft Mountain Dr
- 34 Skyline Dr
- 73 Hazeltop Dr
- 37 Loft Mountain Dr
- 118 Shenandoah Dr Unit SH118
- 12 Loft Mountain Dr Unit LM012
- 108 Estates Rd
- 33 Mac Knight Dr