22 Harding Ave Wareham, MA 02571
Weweantic NeighborhoodEstimated Value: $477,542 - $607,000
1
Bed
2
Baths
875
Sq Ft
$596/Sq Ft
Est. Value
About This Home
This home is located at 22 Harding Ave, Wareham, MA 02571 and is currently estimated at $521,386, approximately $595 per square foot. 22 Harding Ave is a home located in Plymouth County with nearby schools including Tabor Academy.
Ownership History
Date
Name
Owned For
Owner Type
Purchase Details
Closed on
Mar 14, 1994
Sold by
Dannunzio Franco and Dannunzio Lina
Bought by
Chesley Donald and Chesley Janet A
Current Estimated Value
Home Financials for this Owner
Home Financials are based on the most recent Mortgage that was taken out on this home.
Original Mortgage
$75,000
Interest Rate
6.93%
Mortgage Type
Purchase Money Mortgage
Create a Home Valuation Report for This Property
The Home Valuation Report is an in-depth analysis detailing your home's value as well as a comparison with similar homes in the area
Home Values in the Area
Average Home Value in this Area
Purchase History
| Date | Buyer | Sale Price | Title Company |
|---|---|---|---|
| Chesley Donald | $100,000 | -- | |
| Chesley Donald F | $100,000 | -- |
Source: Public Records
Mortgage History
| Date | Status | Borrower | Loan Amount |
|---|---|---|---|
| Closed | Chesley Donald F | $75,000 | |
| Previous Owner | Chesley Donald F | $623,000 |
Source: Public Records
Tax History
| Year | Tax Paid | Tax Assessment Tax Assessment Total Assessment is a certain percentage of the fair market value that is determined by local assessors to be the total taxable value of land and additions on the property. | Land | Improvement |
|---|---|---|---|---|
| 2025 | $5,661 | $543,300 | $261,200 | $282,100 |
| 2024 | $5,222 | $465,000 | $188,700 | $276,300 |
| 2023 | $5,075 | $421,900 | $171,500 | $250,400 |
| 2022 | $5,015 | $380,500 | $171,500 | $209,000 |
| 2021 | $0 | $372,800 | $171,500 | $201,300 |
| 2020 | $6,863 | $359,800 | $171,500 | $188,300 |
| 2019 | $85 | $314,700 | $157,500 | $157,200 |
| 2018 | $6,403 | $284,200 | $157,500 | $126,700 |
| 2017 | $3,621 | $269,200 | $157,500 | $111,700 |
| 2016 | $4,039 | $298,500 | $194,300 | $104,200 |
| 2015 | $3,673 | $281,000 | $194,300 | $86,700 |
| 2014 | $3,718 | $289,300 | $161,200 | $128,100 |
Source: Public Records
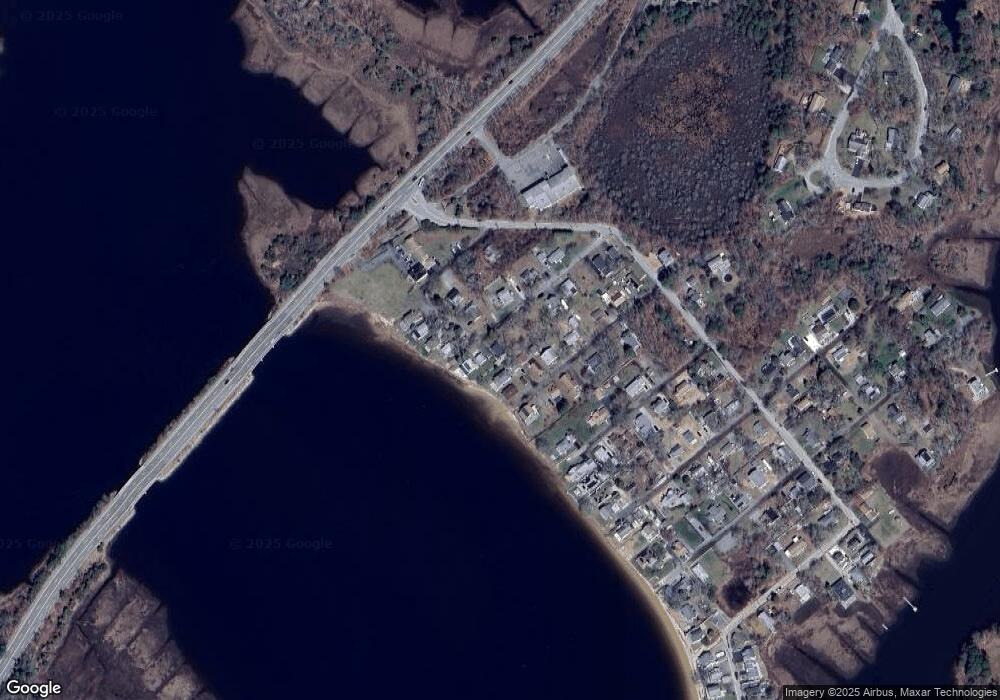
Map
Nearby Homes
- 12 Taft St
- 37 Lincoln Hwy
- 14 Briarwood Dr
- 21 Bisbee St
- 34 Pine Hill Ln
- 0 Cromesett Rd (Off) Unit 73385395
- 929 Point Rd
- 15 14th Ave
- 17 Lynne Rd
- 10 Barnes St
- 21 Bayview St
- 3 Cranberry Grove Way Unit C
- 6 Wildwood Ave
- 3 Lynne Rd
- 233 Marion Rd
- 4 Mather Dr
- 6 Pine St
- 16 Bass Point Rd
- 20 Grant St
- 43 Shore Ave
Your Personal Tour Guide
Ask me questions while you tour the home.