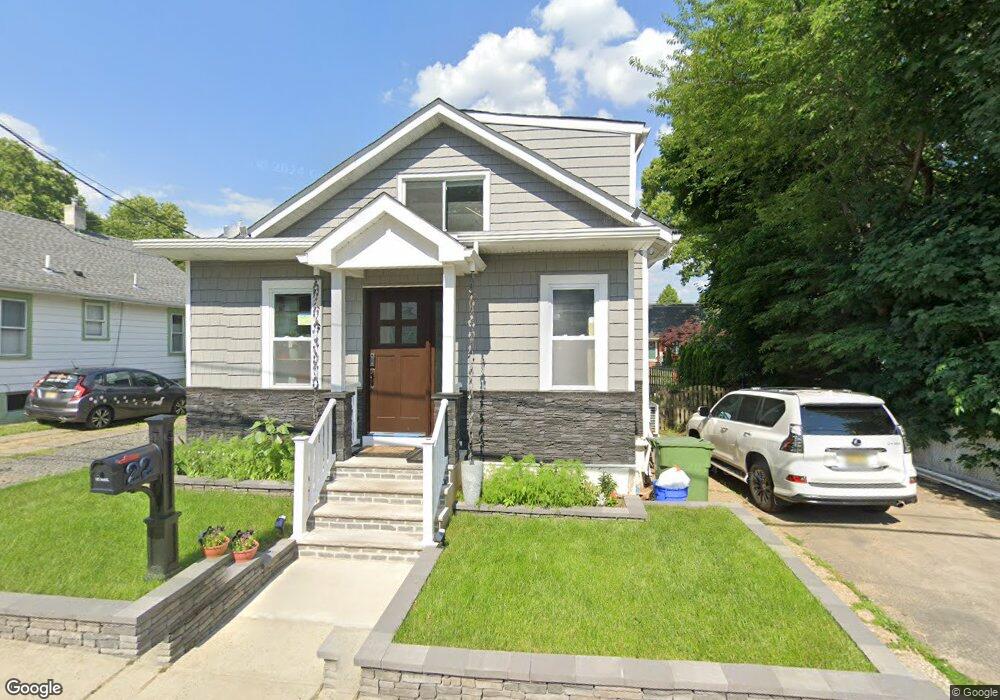
22 Harrison St Sayreville, NJ 08872
Estimated Value: $394,000 - $482,000
3
Beds
2
Baths
1,008
Sq Ft
$443/Sq Ft
Est. Value
About This Home
This home is located at 22 Harrison St, Sayreville, NJ 08872 and is currently estimated at $447,013, approximately $443 per square foot. 22 Harrison St is a home located in Middlesex County with nearby schools including Sayreville War Memorial High School, St. Stanislaus Kostka School, and Darul Arqam School.
Ownership History
Date
Name
Owned For
Owner Type
Purchase Details
Closed on
Jul 28, 2017
Sold by
Fannie Mae
Bought by
Gunasinghe Uruliyanage
Current Estimated Value
Home Financials for this Owner
Home Financials are based on the most recent Mortgage that was taken out on this home.
Original Mortgage
$238,009
Outstanding Balance
$201,423
Interest Rate
4.5%
Mortgage Type
FHA
Estimated Equity
$245,590
Purchase Details
Closed on
Jan 25, 2017
Sold by
Speiser Kerri Ann
Bought by
Federal National Mortgage Association
Purchase Details
Closed on
Dec 3, 2001
Purchase Details
Closed on
Jun 17, 1994
Sold by
Tonzola Gerald
Bought by
Speiser Michael and Speiser Kerri
Home Financials for this Owner
Home Financials are based on the most recent Mortgage that was taken out on this home.
Original Mortgage
$121,000
Interest Rate
8.5%
Create a Home Valuation Report for This Property
The Home Valuation Report is an in-depth analysis detailing your home's value as well as a comparison with similar homes in the area
Home Values in the Area
Average Home Value in this Area
Purchase History
| Date | Buyer | Sale Price | Title Company |
|---|---|---|---|
| Gunasinghe Uruliyanage | $202,000 | Commonwealth Land Title Ins | |
| Federal National Mortgage Association | -- | None Available | |
| -- | -- | -- | |
| Speiser Michael | $127,500 | -- |
Source: Public Records
Mortgage History
| Date | Status | Borrower | Loan Amount |
|---|---|---|---|
| Open | Gunasinghe Uruliyanage | $238,009 | |
| Previous Owner | Speiser Michael | $121,000 |
Source: Public Records
Tax History Compared to Growth
Tax History
| Year | Tax Paid | Tax Assessment Tax Assessment Total Assessment is a certain percentage of the fair market value that is determined by local assessors to be the total taxable value of land and additions on the property. | Land | Improvement |
|---|---|---|---|---|
| 2025 | $6,081 | $119,100 | $47,000 | $72,100 |
| 2024 | $5,912 | $99,600 | $47,000 | $52,600 |
| 2023 | $5,912 | $99,600 | $47,000 | $52,600 |
| 2022 | $5,523 | $99,600 | $47,000 | $52,600 |
| 2021 | $5,462 | $99,600 | $47,000 | $52,600 |
| 2020 | $5,324 | $99,600 | $47,000 | $52,600 |
| 2019 | $5,212 | $99,600 | $47,000 | $52,600 |
| 2018 | $5,047 | $98,200 | $47,000 | $51,200 |
| 2017 | $4,930 | $98,200 | $47,000 | $51,200 |
| 2016 | $4,798 | $98,200 | $47,000 | $51,200 |
| 2015 | $4,689 | $98,200 | $47,000 | $51,200 |
| 2014 | $4,563 | $98,200 | $47,000 | $51,200 |
Source: Public Records
Map
Nearby Homes