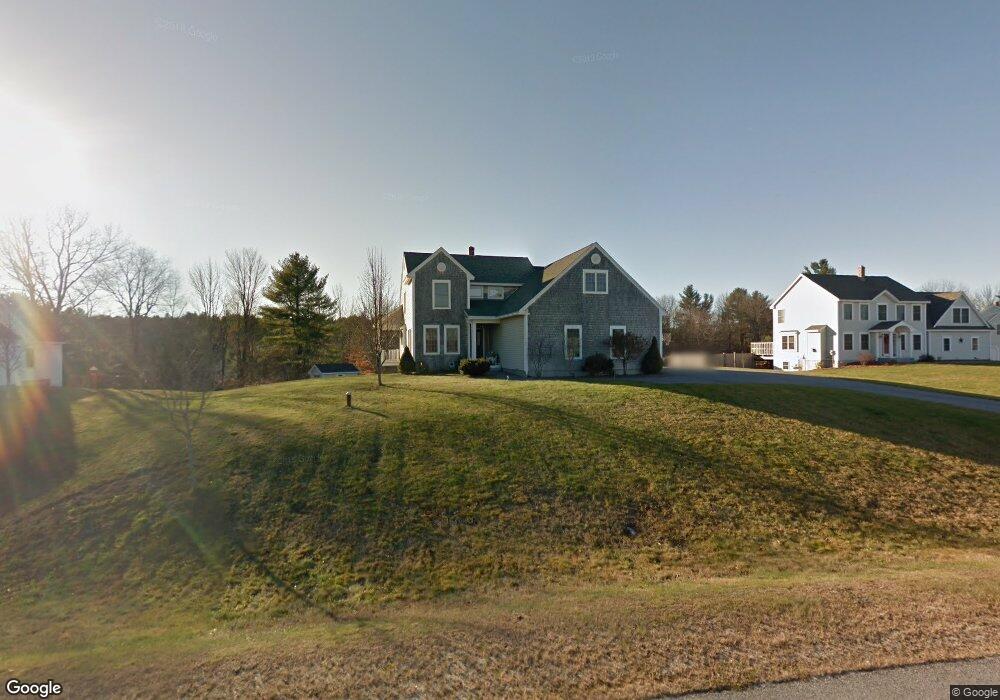
22 Hayfield Dr Gorham, ME 04038
Estimated Value: $734,366 - $832,000
4
Beds
3
Baths
2,748
Sq Ft
$285/Sq Ft
Est. Value
About This Home
This home is located at 22 Hayfield Dr, Gorham, ME 04038 and is currently estimated at $782,342, approximately $284 per square foot. 22 Hayfield Dr is a home located in Cumberland County with nearby schools including Great Falls Elementary School, Gorham Middle School, and Gorham High School.
Ownership History
Date
Name
Owned For
Owner Type
Purchase Details
Closed on
Mar 23, 2010
Sold by
Wright Wayne
Bought by
Tanguay Jason C and Tanguay Debra A
Current Estimated Value
Home Financials for this Owner
Home Financials are based on the most recent Mortgage that was taken out on this home.
Original Mortgage
$283,679
Outstanding Balance
$189,908
Interest Rate
5.5%
Mortgage Type
FHA
Estimated Equity
$592,434
Purchase Details
Closed on
Dec 4, 2009
Sold by
Gilman Susan C
Bought by
Wright Wayne
Purchase Details
Closed on
Feb 16, 2005
Sold by
Risbara Bros Const Co Inc
Bought by
Gilman Susan C
Home Financials for this Owner
Home Financials are based on the most recent Mortgage that was taken out on this home.
Original Mortgage
$280,000
Interest Rate
5.78%
Mortgage Type
Purchase Money Mortgage
Create a Home Valuation Report for This Property
The Home Valuation Report is an in-depth analysis detailing your home's value as well as a comparison with similar homes in the area
Home Values in the Area
Average Home Value in this Area
Purchase History
| Date | Buyer | Sale Price | Title Company |
|---|---|---|---|
| Tanguay Jason C | -- | -- | |
| Wright Wayne | -- | -- | |
| Gilman Susan C | -- | -- |
Source: Public Records
Mortgage History
| Date | Status | Borrower | Loan Amount |
|---|---|---|---|
| Open | Wright Wayne | $283,679 | |
| Previous Owner | Gilman Susan C | $280,000 |
Source: Public Records
Tax History
| Year | Tax Paid | Tax Assessment Tax Assessment Total Assessment is a certain percentage of the fair market value that is determined by local assessors to be the total taxable value of land and additions on the property. | Land | Improvement |
|---|---|---|---|---|
| 2025 | $8,726 | $589,600 | $109,800 | $479,800 |
| 2024 | $8,667 | $589,600 | $109,800 | $479,800 |
| 2023 | $7,990 | $581,100 | $109,800 | $471,300 |
| 2022 | $7,278 | $566,400 | $109,800 | $456,600 |
| 2021 | $7,126 | $367,300 | $81,100 | $286,200 |
| 2020 | $6,979 | $367,300 | $81,100 | $286,200 |
| 2019 | $6,960 | $367,300 | $81,100 | $286,200 |
| 2018 | $6,445 | $354,100 | $81,100 | $273,000 |
| 2017 | $6,055 | $354,100 | $81,100 | $273,000 |
| 2016 | $6,021 | $354,200 | $81,200 | $273,000 |
| 2015 | $5,773 | $354,200 | $81,200 | $273,000 |
| 2014 | $5,876 | $337,700 | $74,700 | $263,000 |
| 2013 | $5,842 | $337,700 | $74,700 | $263,000 |
Source: Public Records
Map
Nearby Homes
- 696 Fort Hill Rd
- 697 Fort Hill Rd
- 761 Fort Hill Rd
- 116 Dingley Spring Rd
- 68 Woodbrey Ln
- LOT #34 Woodbrey Ln
- 555 Fort Hill Rd
- 24 Eastern Ln
- 29 Woodbrey Ln
- LOT #65 Eastern Ln
- LOT #6 Eastern Ln
- LOT #8 Eastern Ln
- LOT #54 Woodbrey Heights
- 49 Woodbrey Ln
- 31 Woodbrey Ln
- 4 Blueberry Ln Unit 4
- 66 Ossipee Trail East Trail E
- 33 Woodbrey Ln
- 63 Ossipee Trail E
- 27 Ossipee Trail E Unit 1
- 28 Hayfield Dr
- 14 Hayfield Dr
- 8 Hayfield Dr
- 4 Hayfield Dr
- LT 12 Hayfield Dr
- 36 Hayfield Dr
- 15 Christopher Rd
- 15 Hayfield Dr
- 13 Christopher Rd
- 17 Christopher Rd
- 42 Hayfield Dr
- 23 Hayfield Dr
- 35 Hay Field Dr
- 35 Hayfield Dr
- 29 Hayfield Dr
- Lot #12 Hayfield Dr
- 41 Hay Field Dr
- 17 Dingley Spring Rd
- 48 Hayfield Dr
- 29 Dingley Spring Rd
Your Personal Tour Guide
Ask me questions while you tour the home.