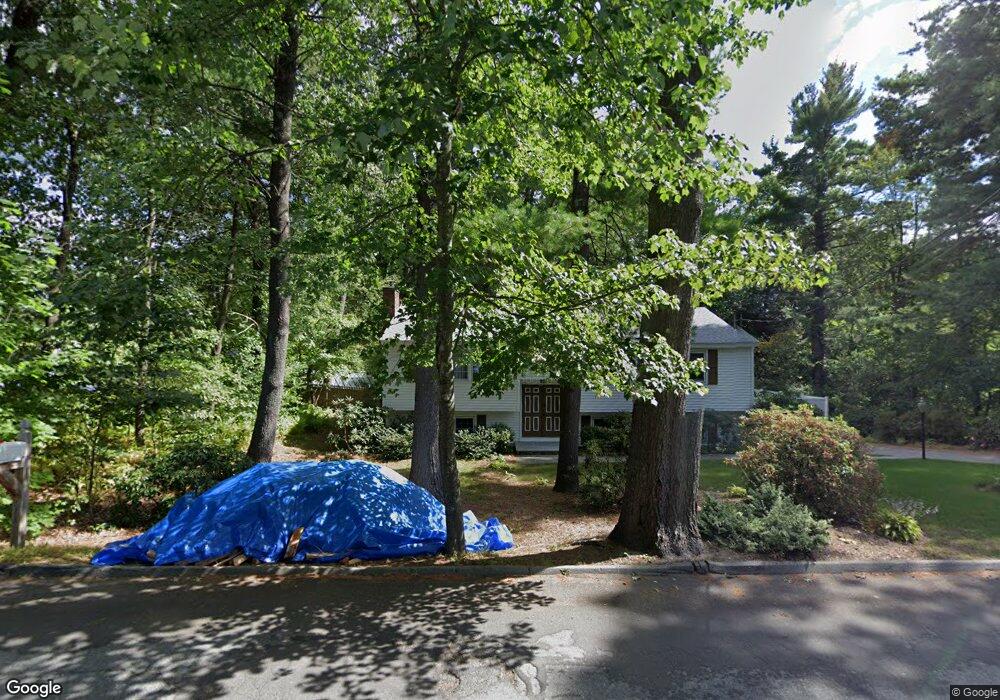
22 Hidden Rd Methuen, MA 01844
The West End NeighborhoodEstimated Value: $598,755 - $666,000
3
Beds
3
Baths
2,114
Sq Ft
$297/Sq Ft
Est. Value
About This Home
This home is located at 22 Hidden Rd, Methuen, MA 01844 and is currently estimated at $627,939, approximately $297 per square foot. 22 Hidden Rd is a home located in Essex County with nearby schools including Marsh Grammar School, South Point Elementary School, and Methuen High School.
Ownership History
Date
Name
Owned For
Owner Type
Purchase Details
Closed on
Mar 26, 2018
Sold by
Silva Lawrence F and Silva Judith F
Bought by
22 Hidden Road Rt and Silva
Current Estimated Value
Purchase Details
Closed on
Sep 1, 1972
Bought by
Silva Lawrence
Create a Home Valuation Report for This Property
The Home Valuation Report is an in-depth analysis detailing your home's value as well as a comparison with similar homes in the area
Home Values in the Area
Average Home Value in this Area
Purchase History
| Date | Buyer | Sale Price | Title Company |
|---|---|---|---|
| 22 Hidden Road Rt | -- | -- | |
| 22 Hidden Road Rt | -- | -- | |
| 22 Hidden Road Rt | -- | -- | |
| Silva Lawrence | -- | -- |
Source: Public Records
Mortgage History
| Date | Status | Borrower | Loan Amount |
|---|---|---|---|
| Previous Owner | Silva Lawrence | $40,000 | |
| Previous Owner | Silva Lawrence | $40,000 | |
| Previous Owner | Silva Lawrence | $40,000 |
Source: Public Records
Tax History Compared to Growth
Tax History
| Year | Tax Paid | Tax Assessment Tax Assessment Total Assessment is a certain percentage of the fair market value that is determined by local assessors to be the total taxable value of land and additions on the property. | Land | Improvement |
|---|---|---|---|---|
| 2025 | $5,621 | $531,300 | $246,700 | $284,600 |
| 2024 | $5,642 | $519,500 | $224,300 | $295,200 |
| 2023 | $5,407 | $462,100 | $200,200 | $261,900 |
| 2022 | $5,113 | $391,800 | $160,200 | $231,600 |
| 2021 | $4,863 | $368,700 | $152,200 | $216,500 |
| 2020 | $4,833 | $359,600 | $152,200 | $207,400 |
| 2019 | $4,742 | $334,200 | $144,200 | $190,000 |
| 2018 | $4,591 | $321,700 | $144,200 | $177,500 |
| 2017 | $4,437 | $302,900 | $144,200 | $158,700 |
| 2016 | $4,394 | $296,700 | $144,200 | $152,500 |
| 2015 | $4,285 | $293,500 | $144,200 | $149,300 |
Source: Public Records
Map
Nearby Homes
- 2 Sugar Hill Cir
- 14 Tyler St
- 38 Butternut Ln
- 1 Tilbury Rd
- 14 Youngfarm Rd
- 86 Butternut Ln
- 90 Butternut Ln
- 492 Lowell St
- 73 Myrtle St
- 100 Salem Rd
- 5 Bailey Rd
- 50 & 51 Jane St
- 11 Vineyard Ln Unit 11
- 362 Lowell St
- 128 West St
- 65 Clayton Ave
- 351 Peters Pond Dr
- 35 Memorial Dr
- 44 Hopkins Cir Unit 44
- 44 Methuen Rd