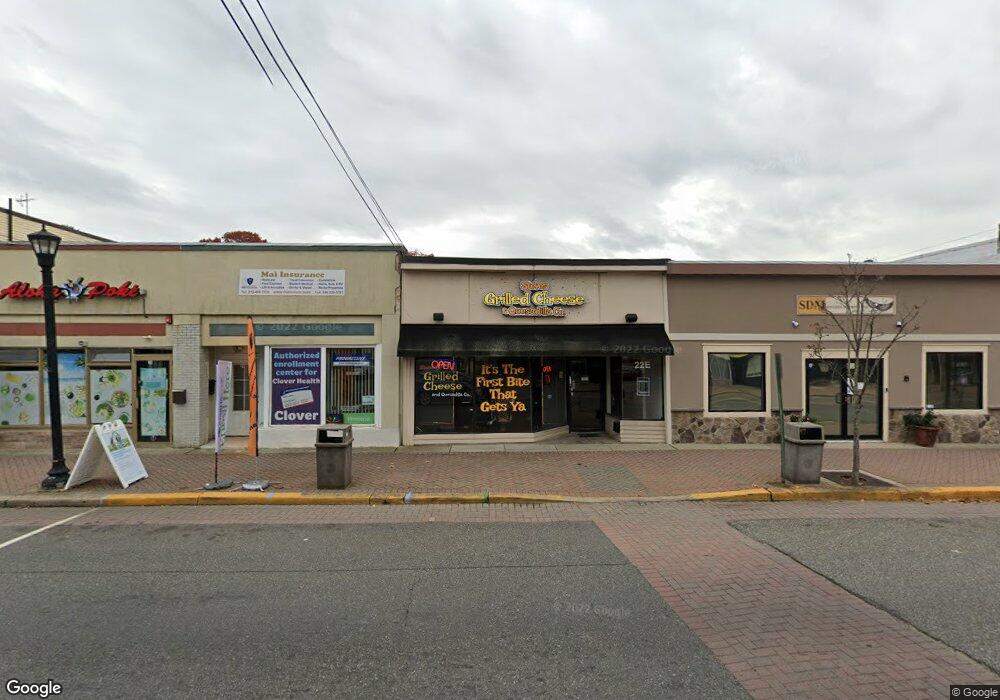
22 High St E Glassboro, NJ 08028
Estimated Value: $483,146
--
Bed
--
Bath
1,152
Sq Ft
$419/Sq Ft
Est. Value
About This Home
This home is located at 22 High St E, Glassboro, NJ 08028 and is currently estimated at $483,146, approximately $419 per square foot. 22 High St E is a home located in Gloucester County with nearby schools including J Harvey Rodgers School, Dorothy L Bullock Elementary, and Glassboro Intermediate School.
Ownership History
Date
Name
Owned For
Owner Type
Purchase Details
Closed on
Jun 2, 2017
Sold by
Petruzzi Robert
Bought by
Jfk Llc
Current Estimated Value
Home Financials for this Owner
Home Financials are based on the most recent Mortgage that was taken out on this home.
Original Mortgage
$5,000
Outstanding Balance
$4,159
Interest Rate
4.02%
Mortgage Type
Commercial
Estimated Equity
$478,987
Purchase Details
Closed on
Jan 4, 2017
Sold by
F D F B Llc
Bought by
Petruzzi Robert
Purchase Details
Closed on
Dec 10, 2009
Sold by
Ltd Unlimited Llc
Bought by
F D F B Limited Liability Company
Purchase Details
Closed on
Sep 14, 2005
Sold by
Borough Of Glassboro
Bought by
Ltd Unlimited Llc
Home Financials for this Owner
Home Financials are based on the most recent Mortgage that was taken out on this home.
Original Mortgage
$64,000
Interest Rate
5.84%
Mortgage Type
Commercial
Create a Home Valuation Report for This Property
The Home Valuation Report is an in-depth analysis detailing your home's value as well as a comparison with similar homes in the area
Home Values in the Area
Average Home Value in this Area
Purchase History
| Date | Buyer | Sale Price | Title Company |
|---|---|---|---|
| Jfk Llc | -- | None Available | |
| Petruzzi Robert | $250,000 | Boardwalk Settlement Service | |
| F D F B Limited Liability Company | $140,000 | None Available | |
| Ltd Unlimited Llc | $25,700 | Continental Title Abstract |
Source: Public Records
Mortgage History
| Date | Status | Borrower | Loan Amount |
|---|---|---|---|
| Open | Jfk Llc | $5,000 | |
| Previous Owner | Ltd Unlimited Llc | $64,000 |
Source: Public Records
Tax History Compared to Growth
Tax History
| Year | Tax Paid | Tax Assessment Tax Assessment Total Assessment is a certain percentage of the fair market value that is determined by local assessors to be the total taxable value of land and additions on the property. | Land | Improvement |
|---|---|---|---|---|
| 2025 | $4,608 | $130,900 | $35,000 | $95,900 |
| 2024 | $4,580 | $130,900 | $35,000 | $95,900 |
| 2023 | $4,580 | $130,900 | $35,000 | $95,900 |
| 2022 | $4,534 | $130,900 | $35,000 | $95,900 |
| 2021 | $4,612 | $130,900 | $35,000 | $95,900 |
| 2020 | $4,638 | $130,900 | $35,000 | $95,900 |
| 2019 | $4,646 | $130,900 | $35,000 | $95,900 |
| 2018 | $4,648 | $130,900 | $35,000 | $95,900 |
| 2017 | $4,671 | $130,900 | $35,000 | $95,900 |
| 2016 | $4,536 | $130,900 | $35,000 | $95,900 |
| 2015 | $4,438 | $130,900 | $35,000 | $95,900 |
| 2014 | $4,337 | $130,900 | $35,000 | $95,900 |
Source: Public Records
Map
Nearby Homes