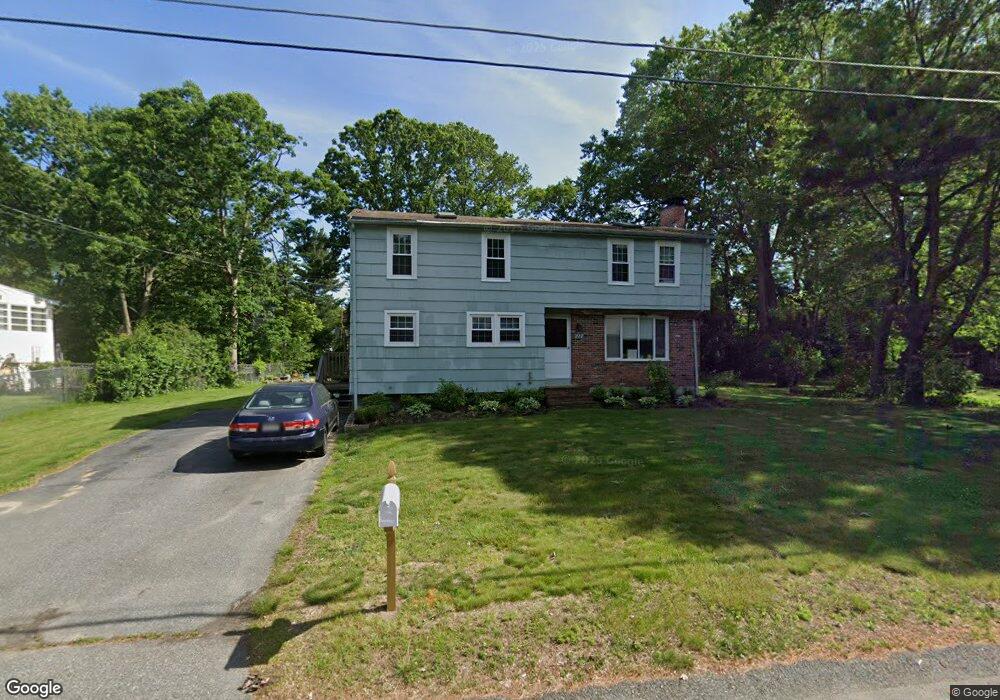
22 Highfield Dr Brockton, MA 02301
Clifton Heights NeighborhoodEstimated Value: $547,449 - $625,000
5
Beds
1
Bath
1,596
Sq Ft
$369/Sq Ft
Est. Value
About This Home
This home is located at 22 Highfield Dr, Brockton, MA 02301 and is currently estimated at $588,362, approximately $368 per square foot. 22 Highfield Dr is a home located in Plymouth County with nearby schools including Gilmore Elementary School, John F. Kennedy Elementary School, and Davis K-8 School.
Ownership History
Date
Name
Owned For
Owner Type
Purchase Details
Closed on
Aug 15, 1991
Sold by
Decatur Edward J and Decatur Lillemor L
Bought by
Tran Tung P and Bui Tam M
Current Estimated Value
Home Financials for this Owner
Home Financials are based on the most recent Mortgage that was taken out on this home.
Original Mortgage
$104,500
Interest Rate
9.56%
Mortgage Type
Purchase Money Mortgage
Create a Home Valuation Report for This Property
The Home Valuation Report is an in-depth analysis detailing your home's value as well as a comparison with similar homes in the area
Home Values in the Area
Average Home Value in this Area
Purchase History
| Date | Buyer | Sale Price | Title Company |
|---|---|---|---|
| Tran Tung P | $110,000 | -- |
Source: Public Records
Mortgage History
| Date | Status | Borrower | Loan Amount |
|---|---|---|---|
| Open | Tran Tung P | $90,000 | |
| Closed | Tran Tung P | $17,000 | |
| Closed | Tran Tung P | $104,500 | |
| Previous Owner | Tran Tung P | $10,000 |
Source: Public Records
Tax History
| Year | Tax Paid | Tax Assessment Tax Assessment Total Assessment is a certain percentage of the fair market value that is determined by local assessors to be the total taxable value of land and additions on the property. | Land | Improvement |
|---|---|---|---|---|
| 2025 | $6,361 | $525,300 | $151,900 | $373,400 |
| 2024 | $5,968 | $496,500 | $151,900 | $344,600 |
| 2023 | $5,786 | $445,800 | $117,400 | $328,400 |
| 2022 | $5,335 | $381,900 | $106,900 | $275,000 |
| 2021 | $5,291 | $364,900 | $99,400 | $265,500 |
| 2020 | $4,438 | $322,400 | $95,200 | $227,200 |
| 2019 | $5,077 | $326,700 | $89,000 | $237,700 |
| 2018 | $4,567 | $284,400 | $89,000 | $195,400 |
| 2017 | $4,262 | $264,700 | $89,000 | $175,700 |
| 2016 | $3,453 | $198,900 | $85,300 | $113,600 |
| 2015 | $3,381 | $186,300 | $85,300 | $101,000 |
| 2014 | $3,256 | $179,600 | $85,300 | $94,300 |
Source: Public Records
Map
Nearby Homes
Your Personal Tour Guide
Ask me questions while you tour the home.