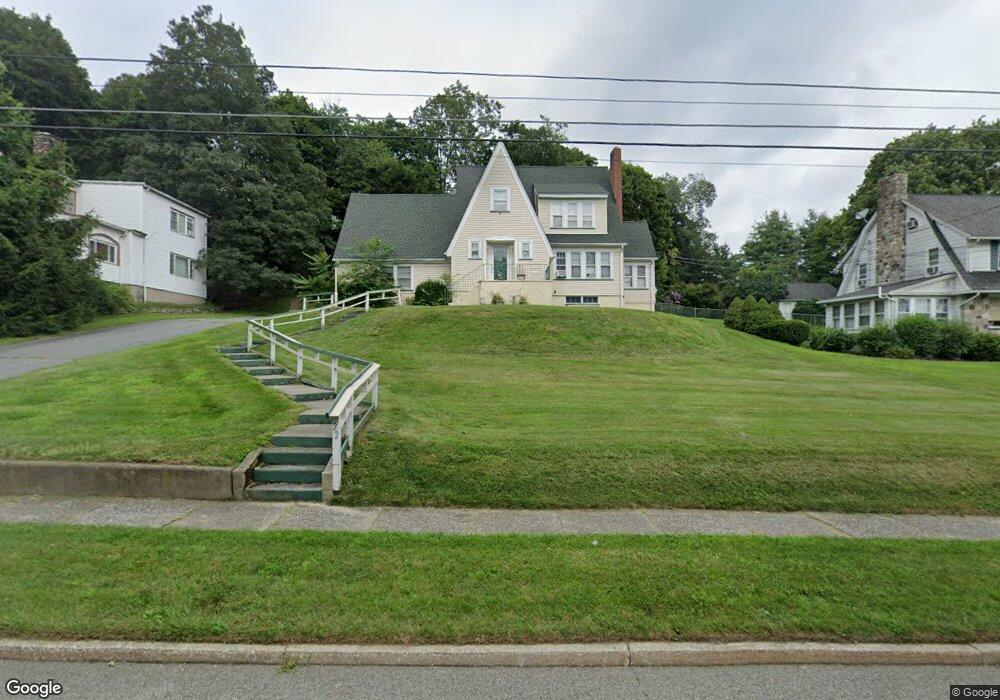
22 Hillside Ave Newton, NJ 07860
Estimated Value: $420,000 - $449,085
Studio
--
Bath
2,243
Sq Ft
$194/Sq Ft
Est. Value
About This Home
This home is located at 22 Hillside Ave, Newton, NJ 07860 and is currently estimated at $435,021, approximately $193 per square foot. 22 Hillside Ave is a home located in Sussex County with nearby schools including Merriam Avenue School, Halsted Street Middle School, and Newton High School.
Ownership History
Date
Name
Owned For
Owner Type
Purchase Details
Closed on
May 15, 2019
Sold by
Kozlowski Suzanne and Estate Of Thomas J Cichon
Bought by
Cichon Thomas P
Current Estimated Value
Purchase Details
Closed on
Jul 24, 2015
Sold by
Cichon Thomas J and Cichon Thomas P
Bought by
Cichon Thomas J
Purchase Details
Closed on
Jan 27, 2014
Sold by
Cichon Thomas J and Cichon Dorothy A
Bought by
Cichon Thomas J and Cichon Thomas P
Create a Home Valuation Report for This Property
The Home Valuation Report is an in-depth analysis detailing your home's value as well as a comparison with similar homes in the area
Home Values in the Area
Average Home Value in this Area
Purchase History
| Date | Buyer | Sale Price | Title Company |
|---|---|---|---|
| Cichon Thomas P | $182,000 | None Available | |
| Cichon Thomas J | $110,950 | Attorney | |
| Cichon Thomas J | $110,950 | None Available |
Source: Public Records
Tax History
| Year | Tax Paid | Tax Assessment Tax Assessment Total Assessment is a certain percentage of the fair market value that is determined by local assessors to be the total taxable value of land and additions on the property. | Land | Improvement |
|---|---|---|---|---|
| 2025 | $10,022 | $388,400 | $93,800 | $294,600 |
| 2024 | $8,988 | $367,500 | $79,800 | $287,700 |
Source: Public Records
Map
Nearby Homes
Your Personal Tour Guide
Ask me questions while you tour the home.