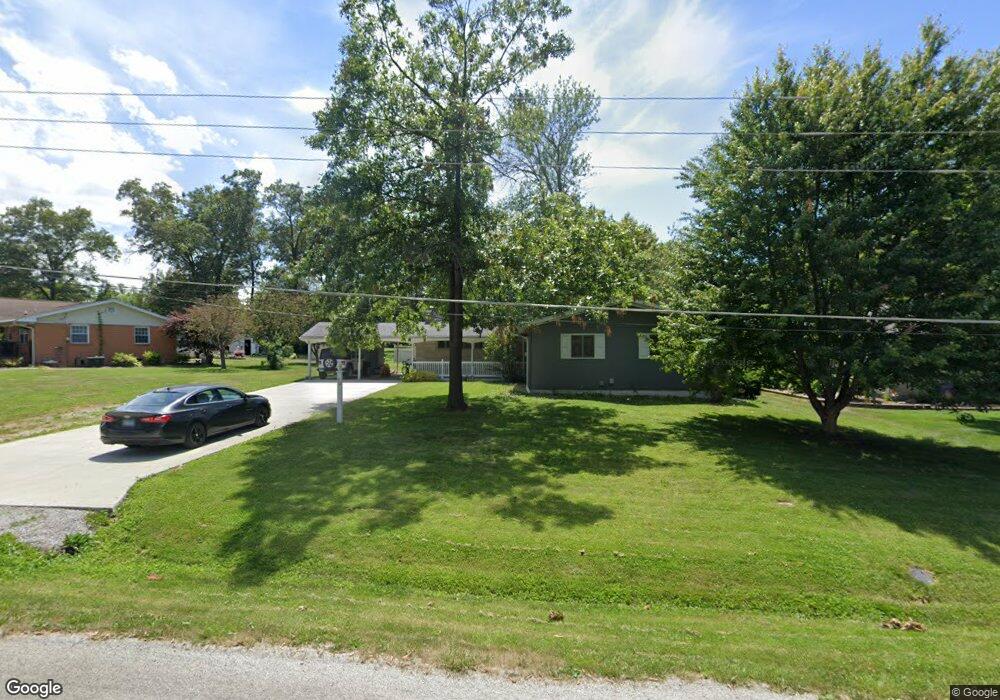
22 Hilltop Dr Hillsboro, IL 62049
Estimated Value: $140,000 - $159,000
3
Beds
2
Baths
1,567
Sq Ft
$94/Sq Ft
Est. Value
About This Home
This home is located at 22 Hilltop Dr, Hillsboro, IL 62049 and is currently estimated at $147,474, approximately $94 per square foot. 22 Hilltop Dr is a home located in Montgomery County with nearby schools including Hillsboro High School.
Ownership History
Date
Name
Owned For
Owner Type
Purchase Details
Closed on
Sep 11, 2025
Sold by
Wall Steven E
Bought by
Wagner James R and Wagner Annaliese M
Current Estimated Value
Home Financials for this Owner
Home Financials are based on the most recent Mortgage that was taken out on this home.
Original Mortgage
$146,700
Outstanding Balance
$146,700
Interest Rate
6.63%
Mortgage Type
New Conventional
Estimated Equity
$774
Purchase Details
Closed on
Nov 8, 2013
Sold by
Cnb Bank & Trust Na
Bought by
Wall Steven E
Home Financials for this Owner
Home Financials are based on the most recent Mortgage that was taken out on this home.
Original Mortgage
$65,600
Interest Rate
5.5%
Mortgage Type
New Conventional
Purchase Details
Closed on
Jan 15, 2013
Sold by
Mastrolia Catherine A
Bought by
Cnb Bank & Trust
Purchase Details
Closed on
Feb 6, 2009
Sold by
Mastrolia Thomas W
Bought by
Mastrolia Catherine A
Create a Home Valuation Report for This Property
The Home Valuation Report is an in-depth analysis detailing your home's value as well as a comparison with similar homes in the area
Home Values in the Area
Average Home Value in this Area
Purchase History
| Date | Buyer | Sale Price | Title Company |
|---|---|---|---|
| Wagner James R | $165,000 | Spears Title | |
| Wall Steven E | $82,000 | -- | |
| Cnb Bank & Trust | $81,300 | None Available | |
| Mastrolia Catherine A | -- | None Available |
Source: Public Records
Mortgage History
| Date | Status | Borrower | Loan Amount |
|---|---|---|---|
| Open | Wagner James R | $146,700 | |
| Previous Owner | Wall Steven E | $65,600 |
Source: Public Records
Tax History Compared to Growth
Tax History
| Year | Tax Paid | Tax Assessment Tax Assessment Total Assessment is a certain percentage of the fair market value that is determined by local assessors to be the total taxable value of land and additions on the property. | Land | Improvement |
|---|---|---|---|---|
| 2024 | $3,281 | $39,380 | $7,740 | $31,640 |
| 2023 | $2,637 | $36,170 | $7,110 | $29,060 |
| 2022 | $2,466 | $33,860 | $6,660 | $27,200 |
| 2021 | $2,313 | $31,040 | $6,110 | $24,930 |
| 2020 | $2,265 | $30,370 | $5,970 | $24,400 |
| 2019 | $2,151 | $28,430 | $5,590 | $22,840 |
| 2018 | $1,979 | $26,000 | $5,110 | $20,890 |
| 2017 | $2,166 | $27,040 | $5,310 | $21,730 |
| 2016 | $2,190 | $28,120 | $5,520 | $22,600 |
| 2015 | $2,913 | $29,250 | $5,740 | $23,510 |
| 2013 | $2,164 | $28,670 | $5,630 | $23,040 |
Source: Public Records
Map
Nearby Homes
- 1310 Vandalia Rd
- 217 W Fairground Ave
- 523 E Tremont St
- 200 W Kinkead Rd
- 631 Lakeview Dr
- 632 Jefferson St
- 425 Rountree St
- 508 E Wood St
- 808 Smith Ln
- 1910 Washington St
- 123 N East St
- 815 E Brailley St
- 136 N Hamilton St
- 316 Mill Ln
- 220 N Grant St
- 238 N Main St
- 58 N Woods Cir
- 0 Illinois 185
- 141 Lakecrest Ln
- 207 Lakewood Dr