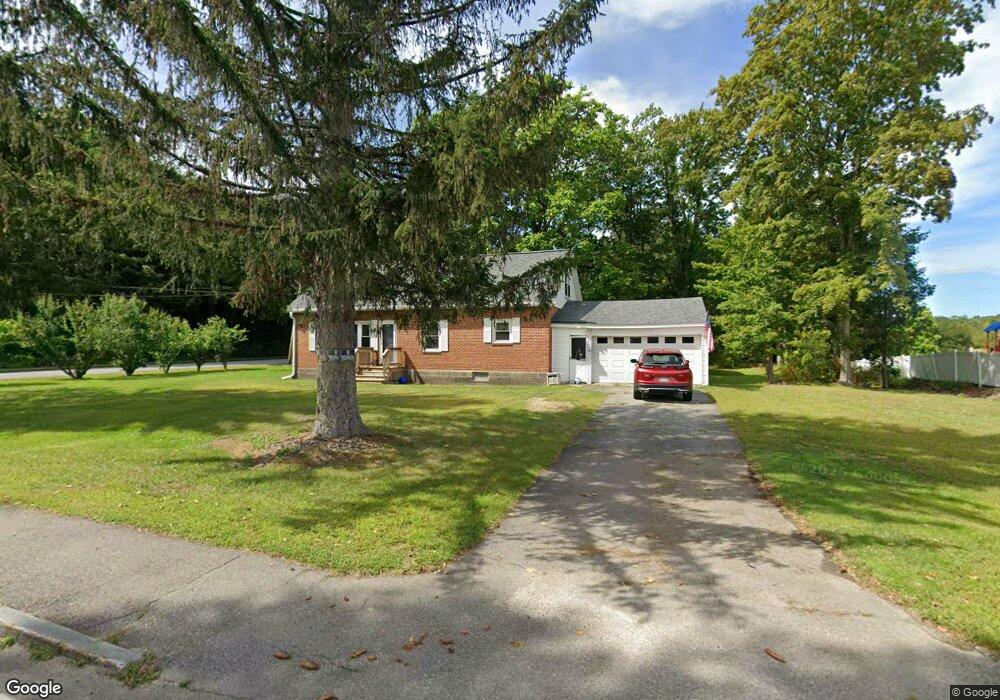
22 Hollis St Pepperell, MA 01463
Estimated Value: $498,157 - $547,000
3
Beds
1
Bath
1,971
Sq Ft
$265/Sq Ft
Est. Value
About This Home
This home is located at 22 Hollis St, Pepperell, MA 01463 and is currently estimated at $521,789, approximately $264 per square foot. 22 Hollis St is a home located in Middlesex County with nearby schools including North Middlesex Regional High School, Pepperell Christian Academy, and Maple Dene & Moppet School.
Ownership History
Date
Name
Owned For
Owner Type
Purchase Details
Closed on
Feb 28, 1994
Sold by
Assn Relocation Mgmt
Bought by
Cobau Gino J and Cobau Marcia A
Current Estimated Value
Home Financials for this Owner
Home Financials are based on the most recent Mortgage that was taken out on this home.
Original Mortgage
$90,000
Interest Rate
6.96%
Mortgage Type
Purchase Money Mortgage
Purchase Details
Closed on
Oct 7, 1993
Sold by
Larson Axel R and Larson Barbara J
Bought by
Assocs Relocation Mgt
Create a Home Valuation Report for This Property
The Home Valuation Report is an in-depth analysis detailing your home's value as well as a comparison with similar homes in the area
Home Values in the Area
Average Home Value in this Area
Purchase History
| Date | Buyer | Sale Price | Title Company |
|---|---|---|---|
| Cobau Gino J | $102,000 | -- | |
| Assocs Relocation Mgt | $105,650 | -- |
Source: Public Records
Mortgage History
| Date | Status | Borrower | Loan Amount |
|---|---|---|---|
| Closed | Assocs Relocation Mgt | $90,000 | |
| Previous Owner | Assocs Relocation Mgt | $60,000 | |
| Previous Owner | Assocs Relocation Mgt | $30,000 |
Source: Public Records
Tax History
| Year | Tax Paid | Tax Assessment Tax Assessment Total Assessment is a certain percentage of the fair market value that is determined by local assessors to be the total taxable value of land and additions on the property. | Land | Improvement |
|---|---|---|---|---|
| 2025 | $5,802 | $396,600 | $166,200 | $230,400 |
| 2024 | $5,497 | $383,100 | $152,700 | $230,400 |
| 2023 | $5,208 | $344,000 | $128,900 | $215,100 |
| 2022 | $4,862 | $283,500 | $101,800 | $181,700 |
| 2021 | $4,785 | $267,000 | $88,200 | $178,800 |
| 2020 | $4,585 | $270,000 | $88,200 | $181,800 |
| 2019 | $4,043 | $243,700 | $88,200 | $155,500 |
| 2018 | $3,843 | $234,500 | $88,200 | $146,300 |
| 2017 | $3,569 | $224,600 | $81,400 | $143,200 |
| 2016 | $3,408 | $206,200 | $81,400 | $124,800 |
| 2015 | $3,289 | $206,200 | $81,400 | $124,800 |
| 2014 | $3,280 | $206,800 | $88,200 | $118,600 |
Source: Public Records
Map
Nearby Homes
- 69 Main St Unit 71
- 39 Hollis St Unit A
- 72 Main St
- 14 Brookline St
- 28-30 Groton St
- 38 River Rd Unit 11
- 4 Townsend St
- 29 Tarbell St
- 8 Casie Ln
- 114 Groton St
- 58 Lowell Rd
- 17 Merrimac Dr
- 27 Merrimac Dr
- 90 Townsend St
- 208 North St
- 96 Townsend St
- 10 Cheyenne Rd
- 39 Mount Lebanon St
- 200 Nashua Rd
- 4 Unkety Brook Way
Your Personal Tour Guide
Ask me questions while you tour the home.