K
Landlord's Agent in 2021
Kirsten Henshaw
Berkshire Hathaway HomeServices Realty Professionals
(413) 238-0421
9 Total Sales
Estimated Value: $372,000 - $437,000
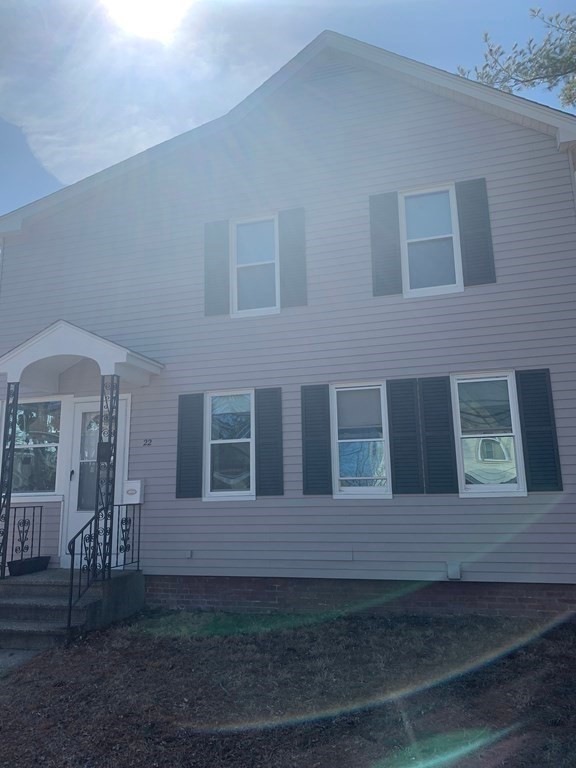
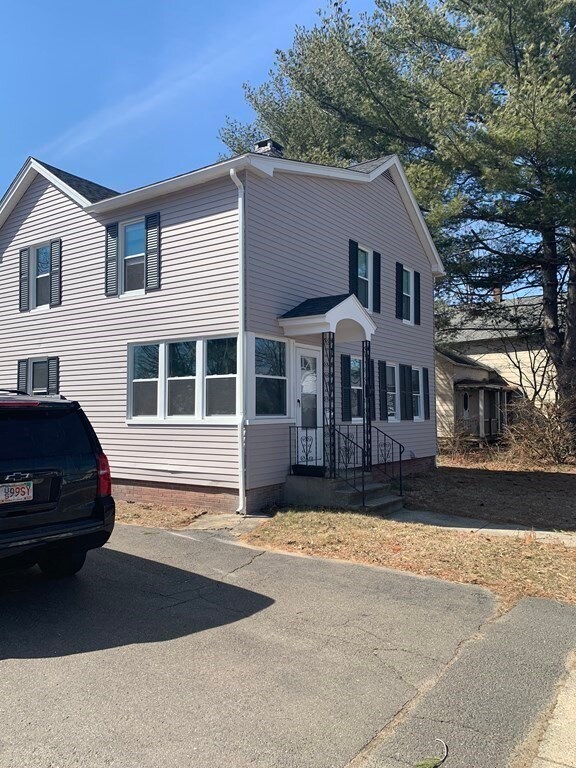
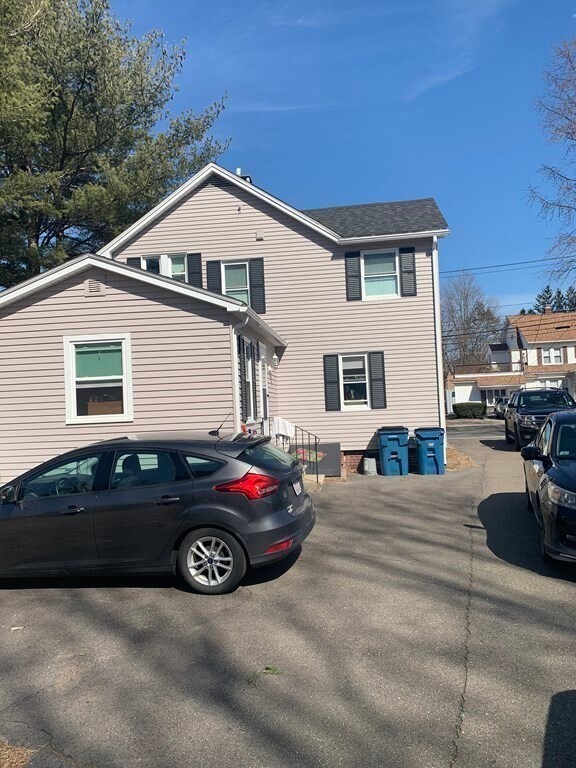
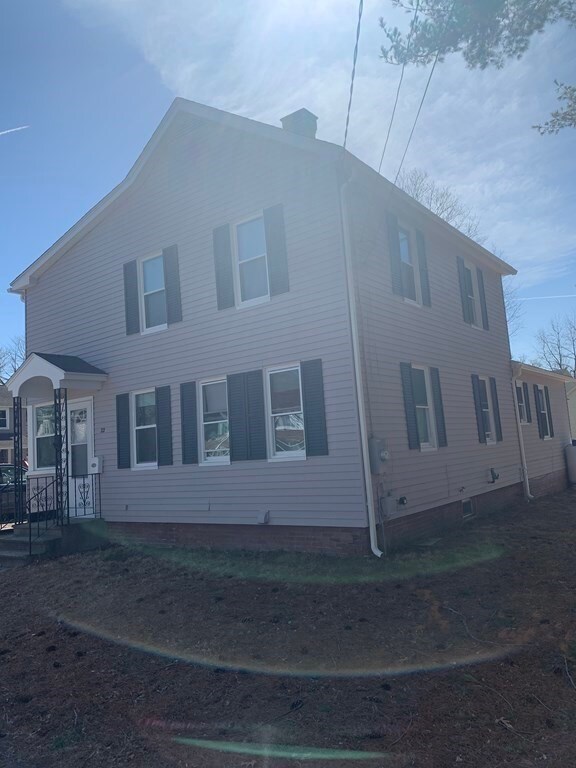
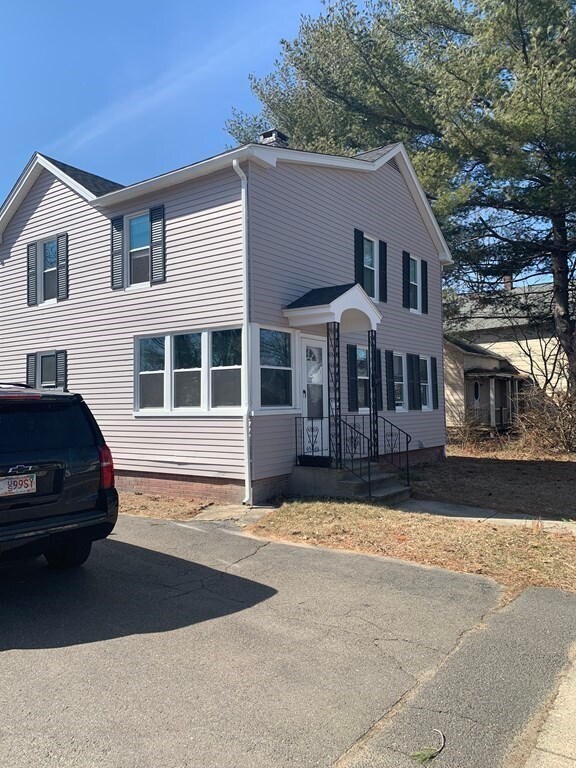
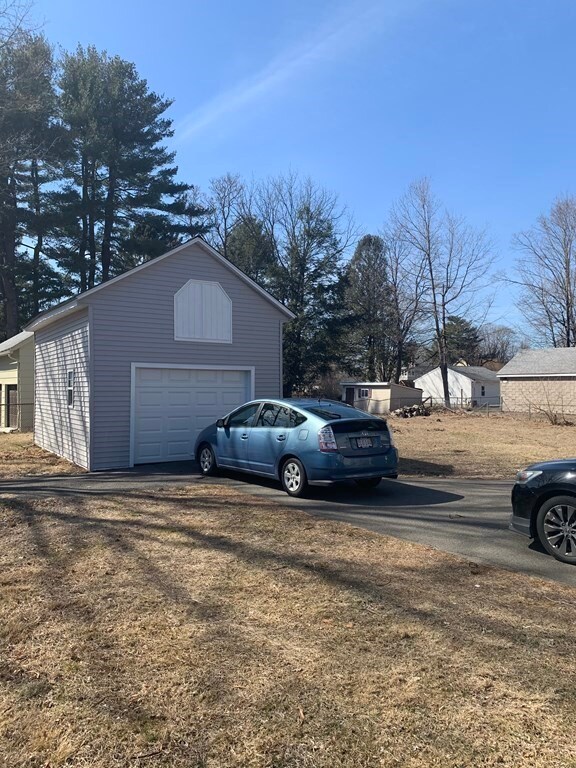
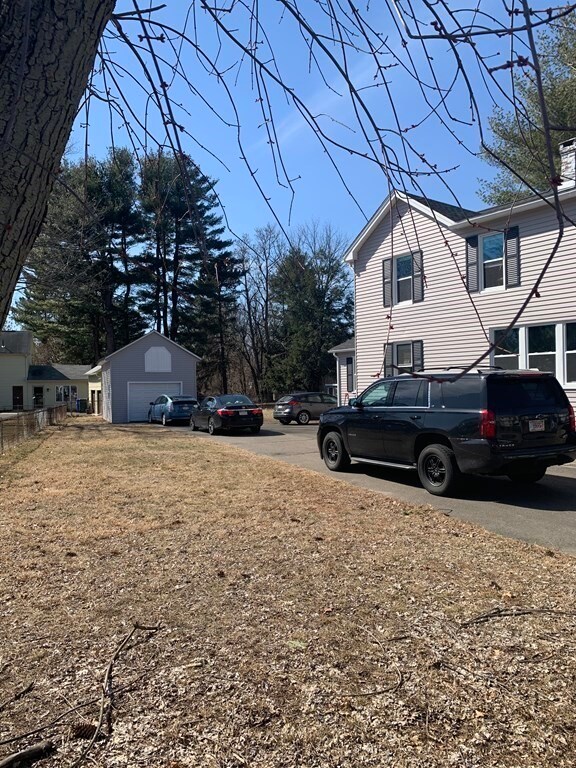
Newly remodeled 4 bedroom home rental. New kitchen cabinets, refrigerator, dishwasher, stove, and microwave for use. New floors throughout home. 1 car garage with off street parking. 2 bathrooms and nice back yard. Call today this will not last.
Last Agent to Rent the Property
Berkshire Hathaway HomeServices Realty Professionals Listed on: 03/18/2021

Last Renter's Agent
Berkshire Hathaway HomeServices Realty Professionals Listed on: 03/18/2021
| Date | Buyer | Sale Price | Title Company |
|---|---|---|---|
| Emond Bryan J | $138,000 | -- |
| Date | Event | Price | List to Sale | Price per Sq Ft | Prior Sale |
|---|---|---|---|---|---|
| 05/01/2021 05/01/21 | Rented | $2,400 | 0.0% | -- | |
| 03/30/2021 03/30/21 | Under Contract | -- | -- | -- | |
| 03/18/2021 03/18/21 | For Rent | $2,400 | 0.0% | -- | |
| 01/03/2018 01/03/18 | Sold | $138,000 | +15.1% | $87 / Sq Ft | View Prior Sale |
| 07/14/2017 07/14/17 | Pending | -- | -- | -- | |
| 06/26/2017 06/26/17 | For Sale | $119,900 | -- | $76 / Sq Ft |
| Year | Tax Paid | Tax Assessment Tax Assessment Total Assessment is a certain percentage of the fair market value that is determined by local assessors to be the total taxable value of land and additions on the property. | Land | Improvement |
|---|---|---|---|---|
| 2025 | $4,861 | $355,600 | $107,300 | $248,300 |
| 2024 | $4,693 | $346,100 | $104,100 | $242,000 |
| 2023 | $3,544 | $241,900 | $82,000 | $159,900 |
| 2022 | $3,999 | $241,900 | $82,000 | $159,900 |
| 2021 | $4,381 | $249,800 | $82,000 | $167,800 |
| 2020 | $4,296 | $241,900 | $82,000 | $159,900 |
| 2019 | $3,520 | $227,700 | $82,000 | $145,700 |
| 2018 | $3,392 | $212,000 | $77,400 | $134,600 |
| 2017 | $3,312 | $204,300 | $74,400 | $129,900 |
| 2016 | $3,160 | $202,700 | $74,400 | $128,300 |
| 2015 | $3,071 | $202,700 | $74,400 | $128,300 |
K
Landlord's Agent in 2021
Kirsten Henshaw
Berkshire Hathaway HomeServices Realty Professionals
(413) 238-0421
9 Total Sales
Seller's Agent in 2018
Susan Lefebvre
HB Real Estate, LLC
(413) 537-2312
2 in this area
67 Total Sales
Source: MLS Property Information Network (MLS PIN)
MLS Number: 72800491
APN: EHAM-000150-000232
Disclaimer: Certain information contained herein is derived from information provided by parties other than Homes.com. All information provided is deemed reliable, but is not guaranteed to be accurate and should be independently verified.
![]() The property listing data and information, or the Images, set forth herein were provided to MLS Property Information Network, Inc. from third party sources, including sellers, lessors and public records, and were compiled by MLS Property Information Network, Inc. The property listing data and information, and the Images, are for the personal, non-commercial use of consumers having a good faith interest in purchasing or leasing listed properties of the type displayed to them and may not be used for any purpose other than to identify prospective properties which such consumers may have a good faith interest in purchasing or leasing. MLS Property Information Network, Inc. and its subscribers disclaim any and all representations and warranties as to the accuracy of the property listing data and information, or as to the accuracy of any of the Images, set forth herein.
The property listing data and information, or the Images, set forth herein were provided to MLS Property Information Network, Inc. from third party sources, including sellers, lessors and public records, and were compiled by MLS Property Information Network, Inc. The property listing data and information, and the Images, are for the personal, non-commercial use of consumers having a good faith interest in purchasing or leasing listed properties of the type displayed to them and may not be used for any purpose other than to identify prospective properties which such consumers may have a good faith interest in purchasing or leasing. MLS Property Information Network, Inc. and its subscribers disclaim any and all representations and warranties as to the accuracy of the property listing data and information, or as to the accuracy of any of the Images, set forth herein.