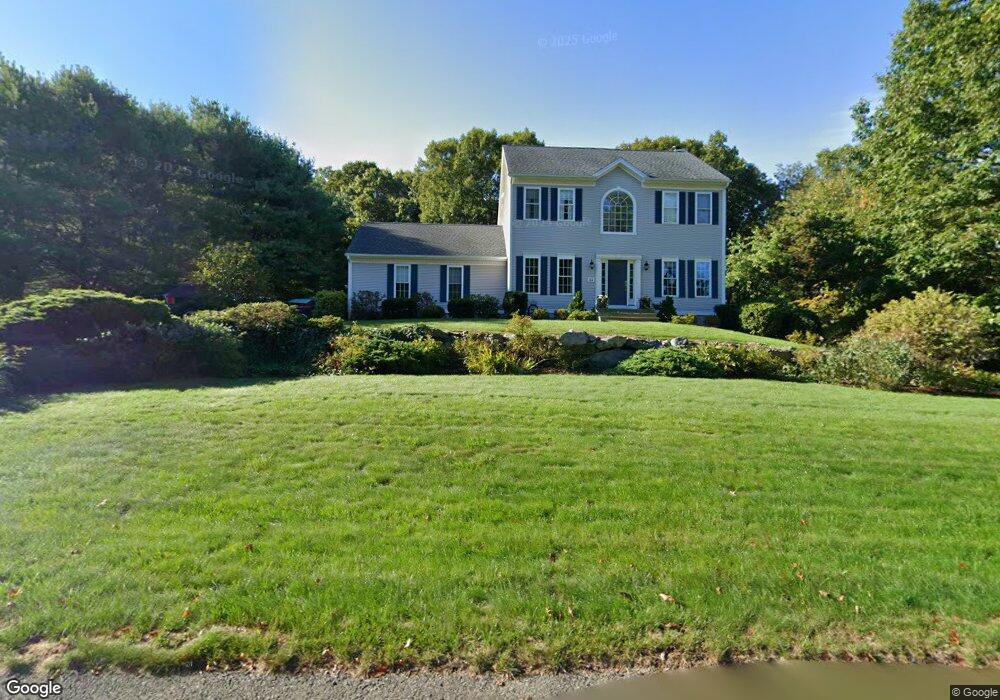
22 Hunt Dr Rehoboth, MA 02769
Estimated Value: $696,228 - $848,000
3
Beds
3
Baths
2,016
Sq Ft
$370/Sq Ft
Est. Value
About This Home
This home is located at 22 Hunt Dr, Rehoboth, MA 02769 and is currently estimated at $745,307, approximately $369 per square foot. 22 Hunt Dr is a home located in Bristol County with nearby schools including Dighton-Rehoboth Regional High School and The Pinecroft School.
Ownership History
Date
Name
Owned For
Owner Type
Purchase Details
Closed on
Jan 11, 2007
Sold by
Valcourt Raymond A and Valcourt Deborah
Bought by
Anghinetti Peter and Anghinetti Karen
Current Estimated Value
Home Financials for this Owner
Home Financials are based on the most recent Mortgage that was taken out on this home.
Original Mortgage
$275,000
Interest Rate
6.18%
Mortgage Type
Purchase Money Mortgage
Purchase Details
Closed on
Jul 17, 2000
Sold by
Monarch Builders Inc
Bought by
Valcourt Raymond A and Valcorut Deborah
Home Financials for this Owner
Home Financials are based on the most recent Mortgage that was taken out on this home.
Original Mortgage
$200,000
Interest Rate
8.5%
Mortgage Type
Purchase Money Mortgage
Create a Home Valuation Report for This Property
The Home Valuation Report is an in-depth analysis detailing your home's value as well as a comparison with similar homes in the area
Home Values in the Area
Average Home Value in this Area
Purchase History
| Date | Buyer | Sale Price | Title Company |
|---|---|---|---|
| Anghinetti Peter | $480,000 | -- | |
| Valcourt Raymond A | $92,000 | -- |
Source: Public Records
Mortgage History
| Date | Status | Borrower | Loan Amount |
|---|---|---|---|
| Open | Valcourt Raymond A | $265,000 | |
| Closed | Valcourt Raymond A | $267,000 | |
| Closed | Anghinetti Peter | $275,000 | |
| Previous Owner | Valcourt Raymond A | $175,000 | |
| Previous Owner | Valcourt Raymond A | $200,000 |
Source: Public Records
Tax History Compared to Growth
Tax History
| Year | Tax Paid | Tax Assessment Tax Assessment Total Assessment is a certain percentage of the fair market value that is determined by local assessors to be the total taxable value of land and additions on the property. | Land | Improvement |
|---|---|---|---|---|
| 2025 | $63 | $569,300 | $199,200 | $370,100 |
| 2024 | $6,471 | $569,600 | $207,900 | $361,700 |
| 2023 | $5,833 | $528,300 | $203,500 | $324,800 |
| 2022 | $5,833 | $460,400 | $186,600 | $273,800 |
| 2021 | $5,575 | $421,100 | $170,000 | $251,100 |
| 2020 | $5,567 | $424,300 | $173,200 | $251,100 |
| 2018 | $4,825 | $403,100 | $169,500 | $233,600 |
| 2017 | $4,794 | $381,700 | $177,100 | $204,600 |
| 2016 | $4,731 | $389,400 | $184,800 | $204,600 |
| 2015 | $4,545 | $369,200 | $176,200 | $193,000 |
| 2014 | $4,485 | $360,500 | $167,500 | $193,000 |
Source: Public Records
Map
Nearby Homes
- 58 Peck St
- 29 & 43 Francis St
- 48 Round Farm Rd
- 2 Round Farm Rd
- 1 Round Farm Rd
- 14 Tremont St
- 70 Forest Hill Dr
- 1120 Glebe St
- 27 Run Brook Cir
- 2045 Winthrop St
- 805 Burt St
- 0 Kimberly Rd
- 701 Winthrop St Unit 312
- 837 Glebe St
- 99 Brigham Hill Rd
- 257 Anawan St
- 240 Smith St
- 24 New St
- 2181 Wheeler St
- 133 Winthrop St