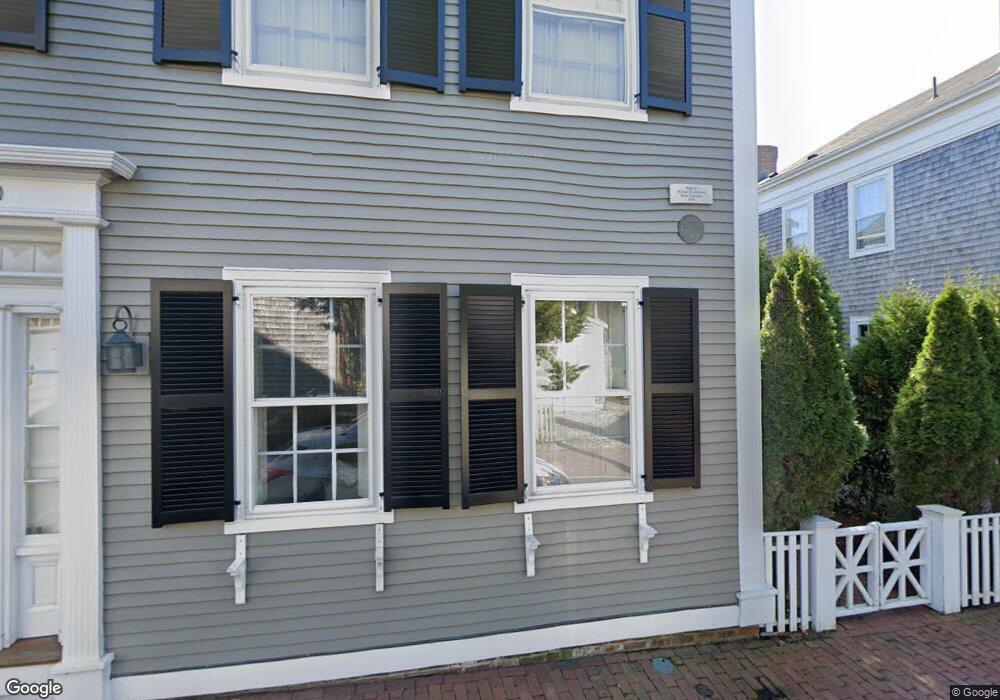
22 Hussey St Nantucket, MA 02554
Estimated Value: $4,902,000 - $6,483,000
4
Beds
4
Baths
2,804
Sq Ft
$1,998/Sq Ft
Est. Value
About This Home
This home is located at 22 Hussey St, Nantucket, MA 02554 and is currently estimated at $5,602,763, approximately $1,998 per square foot. 22 Hussey St is a home located in Nantucket County with nearby schools including Nantucket Elementary School, Cyrus Peirce Middle School, and Nantucket High School.
Ownership History
Date
Name
Owned For
Owner Type
Purchase Details
Closed on
Aug 29, 2008
Sold by
Robinson Phyllis K
Bought by
Richardson Julie and Richardson Matthew
Current Estimated Value
Create a Home Valuation Report for This Property
The Home Valuation Report is an in-depth analysis detailing your home's value as well as a comparison with similar homes in the area
Home Values in the Area
Average Home Value in this Area
Purchase History
| Date | Buyer | Sale Price | Title Company |
|---|---|---|---|
| Richardson Julie | $1,700,000 | -- | |
| Richardson Julie | $1,700,000 | -- | |
| Richardson Julie | $1,700,000 | -- |
Source: Public Records
Mortgage History
| Date | Status | Borrower | Loan Amount |
|---|---|---|---|
| Previous Owner | Richardson Julie | $145,000 | |
| Previous Owner | Richardson Julie | $144,264 | |
| Previous Owner | Richardson Julie | $146,495 |
Source: Public Records
Tax History Compared to Growth
Tax History
| Year | Tax Paid | Tax Assessment Tax Assessment Total Assessment is a certain percentage of the fair market value that is determined by local assessors to be the total taxable value of land and additions on the property. | Land | Improvement |
|---|---|---|---|---|
| 2025 | $14,658 | $4,469,000 | $1,773,700 | $2,695,300 |
| 2024 | $13,869 | $4,431,100 | $1,806,500 | $2,624,600 |
| 2023 | $10,130 | $3,155,800 | $1,188,600 | $1,967,200 |
| 2022 | $9,871 | $2,639,400 | $990,500 | $1,648,900 |
| 2021 | $9,939 | $2,738,000 | $912,300 | $1,825,700 |
| 2020 | $10,422 | $3,021,000 | $912,300 | $2,108,700 |
| 2019 | $10,151 | $3,021,000 | $912,300 | $2,108,700 |
| 2018 | $8,666 | $2,455,000 | $912,300 | $1,542,700 |
| 2017 | $8,083 | $2,384,300 | $912,300 | $1,472,000 |
| 2016 | $7,815 | $2,325,800 | $886,300 | $1,439,500 |
| 2015 | $8,980 | $2,487,600 | $923,600 | $1,564,000 |
| 2014 | $8,937 | $2,376,800 | $812,800 | $1,564,000 |
Source: Public Records
Map
Nearby Homes