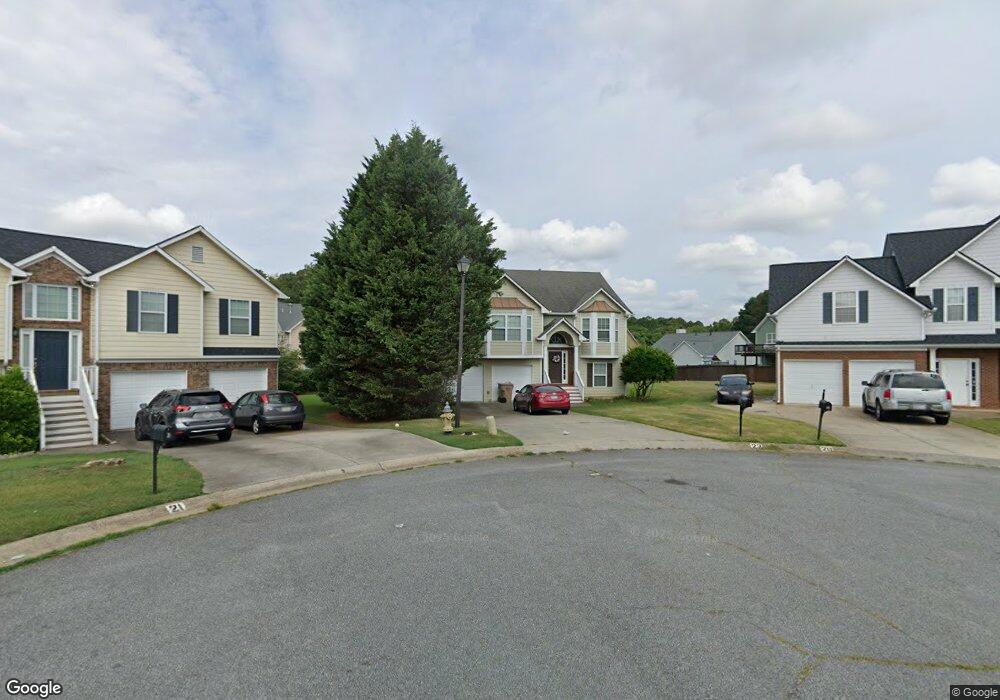
22 Independence Way NE Unit 101 Cartersville, GA 30121
Estimated Value: $358,000 - $421,000
5
Beds
3
Baths
2,649
Sq Ft
$149/Sq Ft
Est. Value
About This Home
This home is located at 22 Independence Way NE Unit 101, Cartersville, GA 30121 and is currently estimated at $394,616, approximately $148 per square foot. 22 Independence Way NE Unit 101 is a home located in Bartow County with nearby schools including Cloverleaf Elementary School, Red Top Middle School, and Woodland High School.
Ownership History
Date
Name
Owned For
Owner Type
Purchase Details
Closed on
Mar 8, 2019
Sold by
Kim Sanya
Bought by
Green Terrell Adolpus and Sandell Brittany Ashley
Current Estimated Value
Home Financials for this Owner
Home Financials are based on the most recent Mortgage that was taken out on this home.
Original Mortgage
$196,377
Outstanding Balance
$172,649
Interest Rate
4.4%
Mortgage Type
FHA
Estimated Equity
$221,967
Purchase Details
Closed on
Jun 5, 2015
Sold by
Federal National Mortgage Association
Bought by
Kim Sanya
Home Financials for this Owner
Home Financials are based on the most recent Mortgage that was taken out on this home.
Original Mortgage
$147,283
Interest Rate
3.88%
Mortgage Type
FHA
Purchase Details
Closed on
Feb 3, 2015
Sold by
Lisiuk Vladimir
Bought by
Federal National Mtg Associati
Create a Home Valuation Report for This Property
The Home Valuation Report is an in-depth analysis detailing your home's value as well as a comparison with similar homes in the area
Home Values in the Area
Average Home Value in this Area
Purchase History
| Date | Buyer | Sale Price | Title Company |
|---|---|---|---|
| Green Terrell Adolpus | $200,000 | -- | |
| Kim Sanya | $150,000 | -- | |
| Federal National Mtg Associati | $129,600 | -- |
Source: Public Records
Mortgage History
| Date | Status | Borrower | Loan Amount |
|---|---|---|---|
| Open | Green Terrell Adolpus | $196,377 | |
| Previous Owner | Kim Sanya | $147,283 |
Source: Public Records
Tax History Compared to Growth
Tax History
| Year | Tax Paid | Tax Assessment Tax Assessment Total Assessment is a certain percentage of the fair market value that is determined by local assessors to be the total taxable value of land and additions on the property. | Land | Improvement |
|---|---|---|---|---|
| 2024 | $4,051 | $166,703 | $22,000 | $144,703 |
| 2023 | $4,051 | $152,194 | $22,000 | $130,194 |
| 2022 | $3,204 | $126,205 | $12,000 | $114,205 |
| 2021 | $2,497 | $93,612 | $12,000 | $81,612 |
| 2020 | $2,198 | $93,612 | $12,000 | $81,612 |
| 2019 | $2,334 | $89,078 | $12,000 | $77,078 |
| 2018 | $1,950 | $74,975 | $6,800 | $68,175 |
| 2017 | $1,768 | $68,132 | $6,800 | $61,332 |
| 2016 | $1,552 | $60,000 | $8,000 | $52,000 |
| 2015 | $1,589 | $56,240 | $8,000 | $48,240 |
| 2014 | -- | $48,880 | $4,000 | $44,880 |
| 2013 | -- | $44,680 | $6,000 | $38,680 |
Source: Public Records
Map
Nearby Homes
- 332 Melody Ln
- 101 Old Tennessee Rd NE
- 206 Daisy Ct
- 204 Daisy Ct NE
- 138 Sunflower Cir NE
- 143 Sunflower Cir NE
- 203 Daisy Ct NE
- 141 Sunflower Cir
- 266 Eva Way
- 200 Daisy Ct
- 88 Cline Smith Rd NE
- 84 Cline-Smith Rd
- 25 Mallet Pointe NE
- 111 Sunflower Cir NE
- 173 Cline Smith Rd NE
- 52 Buena Vista Cir SE
- 31 Churchill Downs NE
- 215 Dupont Dr
- 9 Marguerite Dr
- 19 Roving Hills Cir
- 22 Independence Way NE
- 20 Independence Way NE
- 21 Independence Way NE
- 43 Freedom Dr NE
- 45 Freedom Dr NE
- 29 Liberty Xing Dr NE
- 29 Liberty Dr
- 29 Liberty Dr Unit 87
- 29 Liberty Crossing Dr NE Unit 87
- 49 Freedom Dr NE
- 27 Liberty Xing Dr NE
- 31 Liberty Xing Dr NE
- 41 Freedom Dr NE
- 25 Liberty Xing Dr NE
- 19 Independence Way NE
- 18 Independence Way NE
- 0 Liberty Crossing Dr NE Unit 7029685
- 0 Liberty Crossing Dr NE Unit 8609738
- 0 Liberty Crossing Dr NE Unit 8419865
- 0 Liberty Crossing Dr NE Unit 8132677