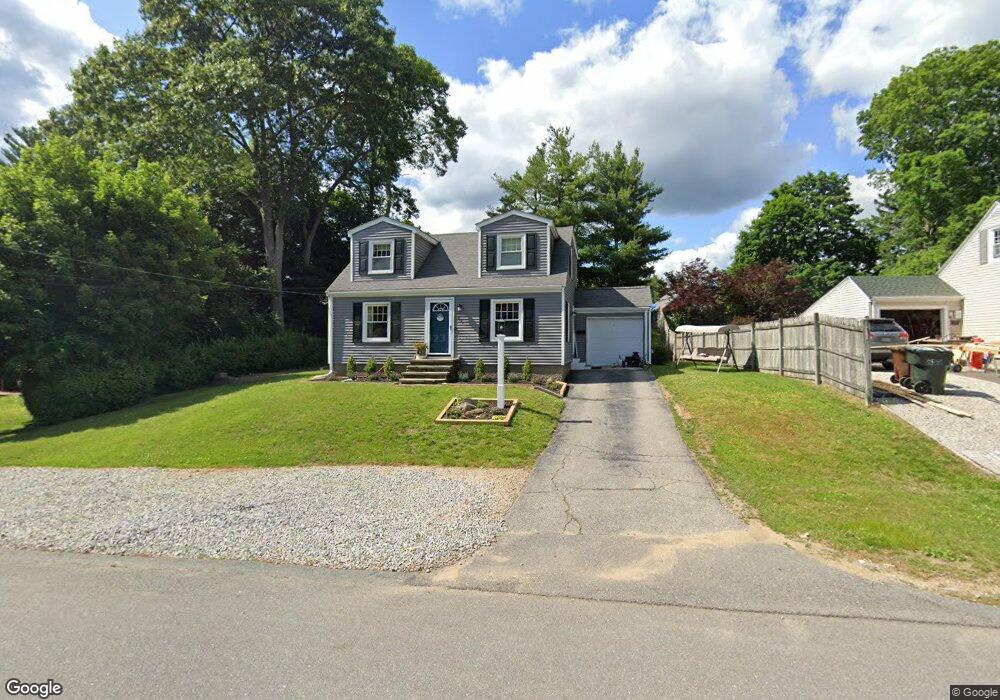
22 Inwood Rd Auburn, MA 01501
Stoneville NeighborhoodEstimated Value: $449,000 - $541,000
4
Beds
3
Baths
1,629
Sq Ft
$306/Sq Ft
Est. Value
About This Home
This home is located at 22 Inwood Rd, Auburn, MA 01501 and is currently estimated at $497,934, approximately $305 per square foot. 22 Inwood Rd is a home located in Worcester County with nearby schools including Auburn Senior High School and Shrewsbury Montessori School - Auburn Campus.
Ownership History
Date
Name
Owned For
Owner Type
Purchase Details
Closed on
Jun 26, 2009
Sold by
Williams Scott M and Williams Susan M
Bought by
Williams Susan M
Current Estimated Value
Home Financials for this Owner
Home Financials are based on the most recent Mortgage that was taken out on this home.
Original Mortgage
$164,000
Interest Rate
4.92%
Mortgage Type
Purchase Money Mortgage
Purchase Details
Closed on
Jun 26, 1996
Sold by
Russell Judith M
Bought by
Williams Scott M and Williams Susan
Create a Home Valuation Report for This Property
The Home Valuation Report is an in-depth analysis detailing your home's value as well as a comparison with similar homes in the area
Home Values in the Area
Average Home Value in this Area
Purchase History
| Date | Buyer | Sale Price | Title Company |
|---|---|---|---|
| Williams Susan M | -- | -- | |
| Williams Scott M | $129,000 | -- |
Source: Public Records
Mortgage History
| Date | Status | Borrower | Loan Amount |
|---|---|---|---|
| Open | Williams Scott M | $146,000 | |
| Closed | Williams Susan M | $164,000 | |
| Previous Owner | Williams Scott M | $138,500 | |
| Previous Owner | Williams Scott M | $12,100 |
Source: Public Records
Tax History Compared to Growth
Tax History
| Year | Tax Paid | Tax Assessment Tax Assessment Total Assessment is a certain percentage of the fair market value that is determined by local assessors to be the total taxable value of land and additions on the property. | Land | Improvement |
|---|---|---|---|---|
| 2025 | $53 | $372,300 | $125,000 | $247,300 |
| 2024 | $5,334 | $357,300 | $118,700 | $238,600 |
| 2023 | $5,248 | $330,500 | $107,900 | $222,600 |
| 2022 | $4,916 | $292,300 | $107,900 | $184,400 |
| 2021 | $9,368 | $258,900 | $95,200 | $163,700 |
| 2020 | $4,542 | $252,600 | $95,200 | $157,400 |
| 2019 | $4,487 | $243,600 | $94,200 | $149,400 |
| 2018 | $8,682 | $232,300 | $88,100 | $144,200 |
| 2017 | $4,110 | $224,100 | $79,900 | $144,200 |
| 2016 | $3,916 | $216,500 | $83,800 | $132,700 |
| 2015 | $3,630 | $210,300 | $83,800 | $126,500 |
| 2014 | $3,525 | $203,900 | $79,700 | $124,200 |
Source: Public Records
Map
Nearby Homes