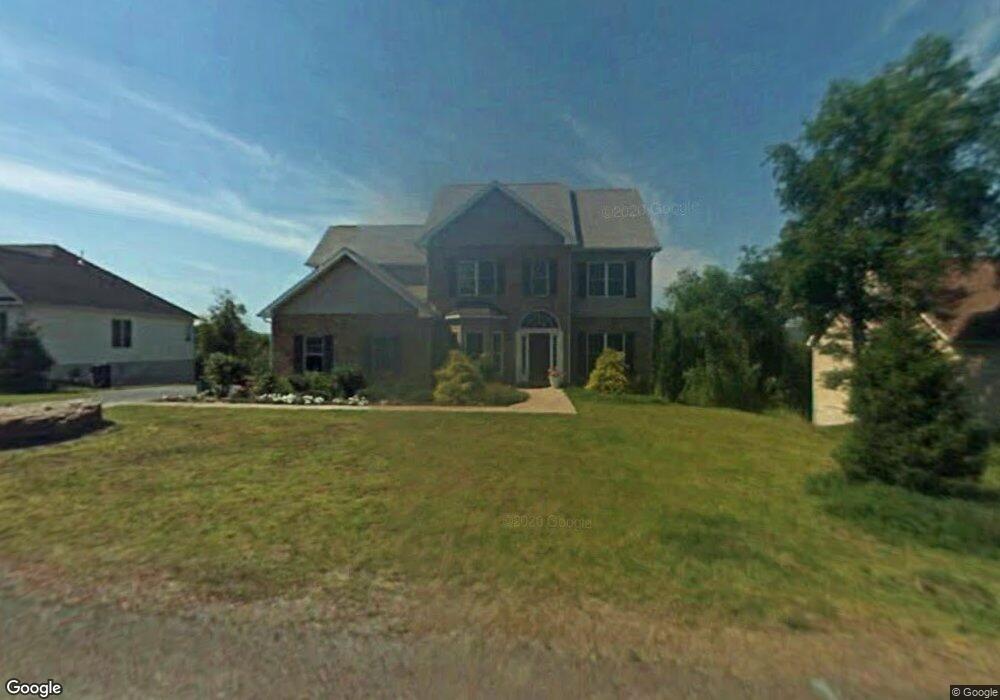
22 Ivy Ln Dupont, PA 18641
Estimated Value: $444,000 - $496,000
4
Beds
3
Baths
2,330
Sq Ft
$200/Sq Ft
Est. Value
About This Home
This home is located at 22 Ivy Ln, Dupont, PA 18641 and is currently estimated at $465,950, approximately $199 per square foot. 22 Ivy Ln is a home located in Luzerne County with nearby schools including Pittston City Intermediate Center, Pittston Area Middle School, and Frederick County Middle School.
Ownership History
Date
Name
Owned For
Owner Type
Purchase Details
Closed on
Jun 25, 2020
Sold by
Kwiatkowski Michael
Bought by
Clarke Patrick and Clarke Mariana
Current Estimated Value
Home Financials for this Owner
Home Financials are based on the most recent Mortgage that was taken out on this home.
Original Mortgage
$319,113
Outstanding Balance
$282,968
Interest Rate
3.1%
Mortgage Type
FHA
Estimated Equity
$182,982
Purchase Details
Closed on
Jan 4, 2019
Sold by
Miele Drew P and Miele Erin P
Bought by
Kwiatkowski Michael
Purchase Details
Closed on
May 8, 2003
Bought by
Miele Drew P
Create a Home Valuation Report for This Property
The Home Valuation Report is an in-depth analysis detailing your home's value as well as a comparison with similar homes in the area
Home Values in the Area
Average Home Value in this Area
Purchase History
| Date | Buyer | Sale Price | Title Company |
|---|---|---|---|
| Clarke Patrick | $325,000 | Centurion Abstract Inc | |
| Kwiatkowski Michael | $132,500 | None Available | |
| Miele Drew P | $259,000 | -- |
Source: Public Records
Mortgage History
| Date | Status | Borrower | Loan Amount |
|---|---|---|---|
| Open | Clarke Patrick | $319,113 |
Source: Public Records
Tax History Compared to Growth
Tax History
| Year | Tax Paid | Tax Assessment Tax Assessment Total Assessment is a certain percentage of the fair market value that is determined by local assessors to be the total taxable value of land and additions on the property. | Land | Improvement |
|---|---|---|---|---|
| 2025 | $6,291 | $255,500 | $70,500 | $185,000 |
| 2024 | $6,291 | $255,500 | $70,500 | $185,000 |
| 2023 | $6,291 | $255,500 | $70,500 | $185,000 |
| 2022 | $6,243 | $255,500 | $70,500 | $185,000 |
| 2021 | $6,243 | $255,500 | $70,500 | $185,000 |
| 2020 | $7,834 | $328,100 | $70,500 | $257,600 |
| 2019 | $7,770 | $328,100 | $70,500 | $257,600 |
| 2018 | $7,608 | $328,100 | $70,500 | $257,600 |
| 2017 | $7,276 | $328,100 | $70,500 | $257,600 |
| 2016 | -- | $328,100 | $70,500 | $257,600 |
| 2015 | $6,261 | $328,100 | $70,500 | $257,600 |
| 2014 | $6,261 | $328,100 | $70,500 | $257,600 |
Source: Public Records
Map
Nearby Homes