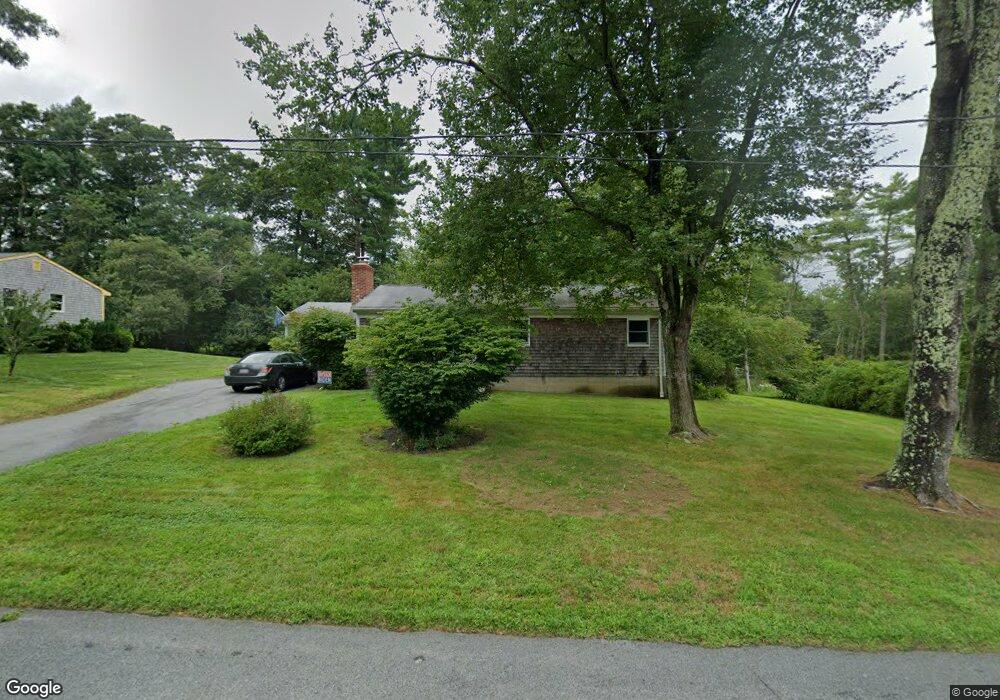
22 James Ave Westport, MA 02790
North Westport NeighborhoodEstimated Value: $438,000 - $516,000
3
Beds
4
Baths
1,184
Sq Ft
$397/Sq Ft
Est. Value
About This Home
This home is located at 22 James Ave, Westport, MA 02790 and is currently estimated at $470,110, approximately $397 per square foot. 22 James Ave is a home located in Bristol County with nearby schools including Alice A. Macomber Primary School, Westport Elementary School, and Westport Middle-High School.
Ownership History
Date
Name
Owned For
Owner Type
Purchase Details
Closed on
Mar 24, 2025
Sold by
Furtado Vernon E and Furtado Lorraine
Bought by
Furtado
Current Estimated Value
Purchase Details
Closed on
Apr 27, 1973
Bought by
Furtado Vernon E and Furtado Lorraine
Create a Home Valuation Report for This Property
The Home Valuation Report is an in-depth analysis detailing your home's value as well as a comparison with similar homes in the area
Home Values in the Area
Average Home Value in this Area
Purchase History
| Date | Buyer | Sale Price | Title Company |
|---|---|---|---|
| Furtado | -- | None Available | |
| Furtado | -- | None Available | |
| Furtado | -- | None Available | |
| Furtado Vernon E | -- | -- |
Source: Public Records
Mortgage History
| Date | Status | Borrower | Loan Amount |
|---|---|---|---|
| Previous Owner | Furtado Vernon E | $38,000 |
Source: Public Records
Tax History Compared to Growth
Tax History
| Year | Tax Paid | Tax Assessment Tax Assessment Total Assessment is a certain percentage of the fair market value that is determined by local assessors to be the total taxable value of land and additions on the property. | Land | Improvement |
|---|---|---|---|---|
| 2025 | $2,625 | $352,300 | $161,800 | $190,500 |
| 2024 | $2,612 | $337,900 | $149,900 | $188,000 |
| 2023 | $2,523 | $309,200 | $136,600 | $172,600 |
| 2022 | $2,301 | $271,300 | $124,200 | $147,100 |
| 2021 | $6,678 | $260,000 | $112,900 | $147,100 |
| 2020 | $2,154 | $255,500 | $108,400 | $147,100 |
| 2019 | $2,107 | $254,800 | $108,400 | $146,400 |
| 2018 | $1,979 | $242,200 | $109,600 | $132,600 |
| 2017 | $1,882 | $236,100 | $106,100 | $130,000 |
| 2016 | $1,746 | $220,700 | $102,600 | $118,100 |
| 2015 | $1,668 | $210,300 | $104,900 | $105,400 |
Source: Public Records
Map
Nearby Homes