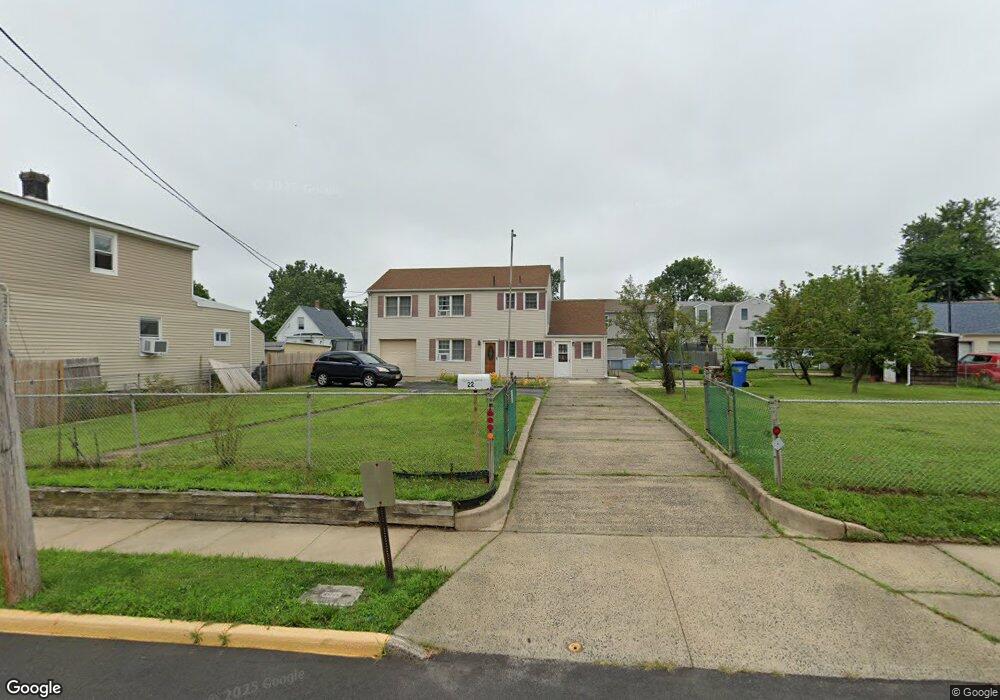
22 James St Perth Amboy, NJ 08861
Estimated Value: $440,104 - $672,000
5
Beds
2
Baths
2,232
Sq Ft
$259/Sq Ft
Est. Value
About This Home
This home is located at 22 James St, Perth Amboy, NJ 08861 and is currently estimated at $578,526, approximately $259 per square foot. 22 James St is a home located in Middlesex County with nearby schools including Port Reading Elementary School, Fords Middle School, and John F. Kennedy Memorial High School.
Ownership History
Date
Name
Owned For
Owner Type
Purchase Details
Closed on
Sep 18, 2020
Sold by
Travis Elizabeth and Cavallaro Mary Ann
Bought by
Candelario Juan J
Current Estimated Value
Home Financials for this Owner
Home Financials are based on the most recent Mortgage that was taken out on this home.
Original Mortgage
$381,954
Outstanding Balance
$338,188
Interest Rate
2.9%
Mortgage Type
New Conventional
Estimated Equity
$240,338
Purchase Details
Closed on
Jun 22, 2020
Sold by
Ciallella Garon and Estate Of Garon Ciallella
Bought by
Travis Elizabeth and Cavallaro Mary Ann
Purchase Details
Closed on
Sep 25, 2009
Sold by
Ciallella Gaton
Bought by
Ciallella Gaton and Travis Elizabeth
Create a Home Valuation Report for This Property
The Home Valuation Report is an in-depth analysis detailing your home's value as well as a comparison with similar homes in the area
Home Values in the Area
Average Home Value in this Area
Purchase History
| Date | Buyer | Sale Price | Title Company |
|---|---|---|---|
| Candelario Juan J | $389,000 | M D A Title Agency Llc | |
| Candelario Juan J | $389,000 | M A D Title Agency | |
| Travis Elizabeth | -- | None Available | |
| Ciallella Gaton | -- | None Available |
Source: Public Records
Mortgage History
| Date | Status | Borrower | Loan Amount |
|---|---|---|---|
| Open | Candelario Juan J | $381,954 | |
| Closed | Candelario Juan J | $381,954 |
Source: Public Records
Tax History Compared to Growth
Tax History
| Year | Tax Paid | Tax Assessment Tax Assessment Total Assessment is a certain percentage of the fair market value that is determined by local assessors to be the total taxable value of land and additions on the property. | Land | Improvement |
|---|---|---|---|---|
| 2025 | $8,958 | $70,600 | $30,000 | $40,600 |
| 2024 | $8,734 | $70,600 | $30,000 | $40,600 |
| 2023 | $8,734 | $70,600 | $30,000 | $40,600 |
| 2022 | $8,483 | $70,600 | $30,000 | $40,600 |
| 2021 | $8,479 | $70,600 | $30,000 | $40,600 |
| 2020 | $7,843 | $69,800 | $30,000 | $39,800 |
| 2019 | $7,648 | $69,800 | $30,000 | $39,800 |
| 2018 | $7,471 | $69,800 | $30,000 | $39,800 |
| 2017 | $7,327 | $69,800 | $30,000 | $39,800 |
| 2016 | $7,501 | $69,800 | $30,000 | $39,800 |
| 2015 | $7,116 | $69,800 | $30,000 | $39,800 |
| 2014 | $6,923 | $69,800 | $30,000 | $39,800 |
Source: Public Records
Map
Nearby Homes