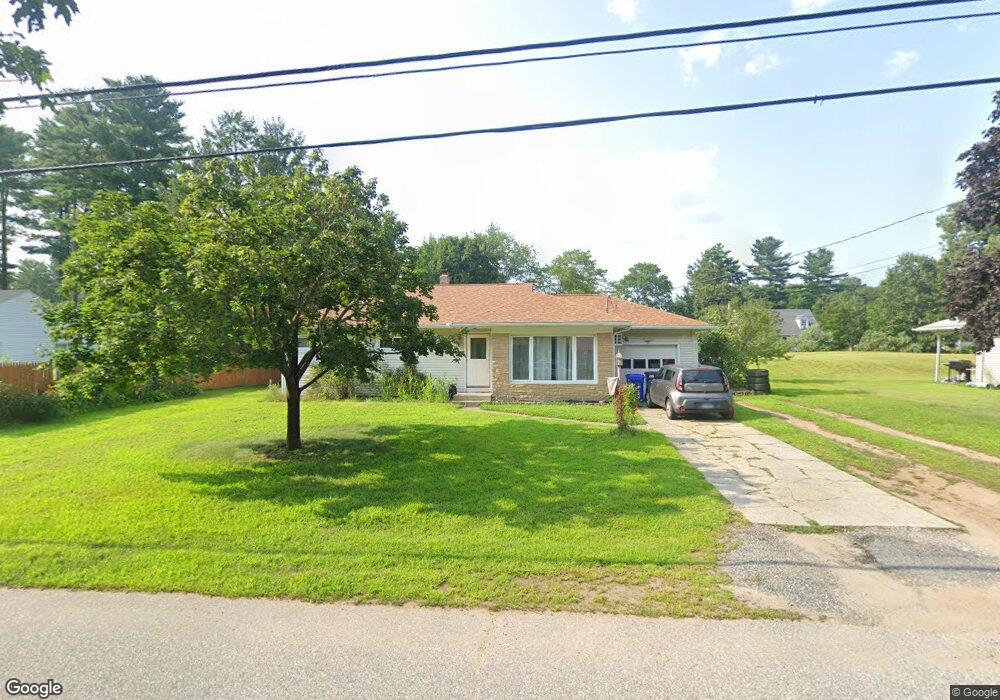
22 Jolly Rd Danielson, CT 06239
Estimated Value: $284,000 - $321,000
3
Beds
1
Bath
1,105
Sq Ft
$277/Sq Ft
Est. Value
About This Home
This home is located at 22 Jolly Rd, Danielson, CT 06239 and is currently estimated at $306,409, approximately $277 per square foot. 22 Jolly Rd is a home located in Windham County with nearby schools including Plainfield Memorial School, Plainfield Central Middle School, and Plainfield High School.
Ownership History
Date
Name
Owned For
Owner Type
Purchase Details
Closed on
Sep 20, 2021
Sold by
Young Robert A and Young Elizabeth A
Bought by
Vinal Ian
Current Estimated Value
Home Financials for this Owner
Home Financials are based on the most recent Mortgage that was taken out on this home.
Original Mortgage
$195,360
Outstanding Balance
$177,375
Interest Rate
2.8%
Mortgage Type
FHA
Estimated Equity
$129,034
Purchase Details
Closed on
Jan 20, 2005
Sold by
Fontaine Jason J
Bought by
Young Robert A and Kist Elizabeth A
Purchase Details
Closed on
Mar 1, 1999
Sold by
Rochefort Raymond and Rochefort Kelley L
Bought by
Fontaine Jason J
Purchase Details
Closed on
Nov 17, 1989
Sold by
Cole Brian
Bought by
Rockefort Raymond
Create a Home Valuation Report for This Property
The Home Valuation Report is an in-depth analysis detailing your home's value as well as a comparison with similar homes in the area
Home Values in the Area
Average Home Value in this Area
Purchase History
| Date | Buyer | Sale Price | Title Company |
|---|---|---|---|
| Vinal Ian | $240,000 | None Available | |
| Vinal Ian | $240,000 | None Available | |
| Young Robert A | $196,000 | -- | |
| Young Robert A | $196,000 | -- | |
| Fontaine Jason J | $93,500 | -- | |
| Fontaine Jason J | $93,500 | -- | |
| Rockefort Raymond | $110,000 | -- |
Source: Public Records
Mortgage History
| Date | Status | Borrower | Loan Amount |
|---|---|---|---|
| Open | Vinal Ian | $195,360 | |
| Closed | Vinal Ian | $195,360 | |
| Previous Owner | Rockefort Raymond | $154,300 | |
| Previous Owner | Rockefort Raymond | $16,000 |
Source: Public Records
Tax History
| Year | Tax Paid | Tax Assessment Tax Assessment Total Assessment is a certain percentage of the fair market value that is determined by local assessors to be the total taxable value of land and additions on the property. | Land | Improvement |
|---|---|---|---|---|
| 2025 | $3,951 | $165,580 | $30,800 | $134,780 |
| 2024 | $3,875 | $165,580 | $30,800 | $134,780 |
| 2023 | $3,774 | $165,580 | $30,800 | $134,780 |
| 2022 | $4,812 | $100,910 | $26,620 | $74,290 |
| 2021 | $3,091 | $100,910 | $26,620 | $74,290 |
| 2020 | $3,091 | $100,910 | $26,620 | $74,290 |
| 2019 | $3,091 | $100,910 | $26,620 | $74,290 |
| 2018 | $3,054 | $100,910 | $26,620 | $74,290 |
| 2017 | $2,846 | $88,330 | $22,420 | $65,910 |
| 2016 | $2,769 | $88,330 | $22,420 | $65,910 |
| 2015 | $2,708 | $88,330 | $22,420 | $65,910 |
| 2014 | $2,708 | $88,330 | $22,420 | $65,910 |
Source: Public Records
Map
Nearby Homes
- 22 Jolley Rd
- 33 Junior Ave
- 101 All Hallows Rd
- 365-367 Putnam Rd
- 79 All Hallows Rd
- 0 Wauregan Rd NE Unit 24143170
- 30 S Walnut St
- 247 Green Hollow Rd
- 44-46 S Chestnut St
- 263 Christian Hill Rd
- 193 Christian Hill Rd
- 169 Moosup Pond Rd
- 77 Charlotte Dr
- 277 Moosup Pond Rd
- 147 South St
- 279 Gorman Rd
- 37 Cady St
- 43 Fall Brook Rd
- 13 Henry Dr
- 200 Pond Hill Rd
Your Personal Tour Guide
Ask me questions while you tour the home.