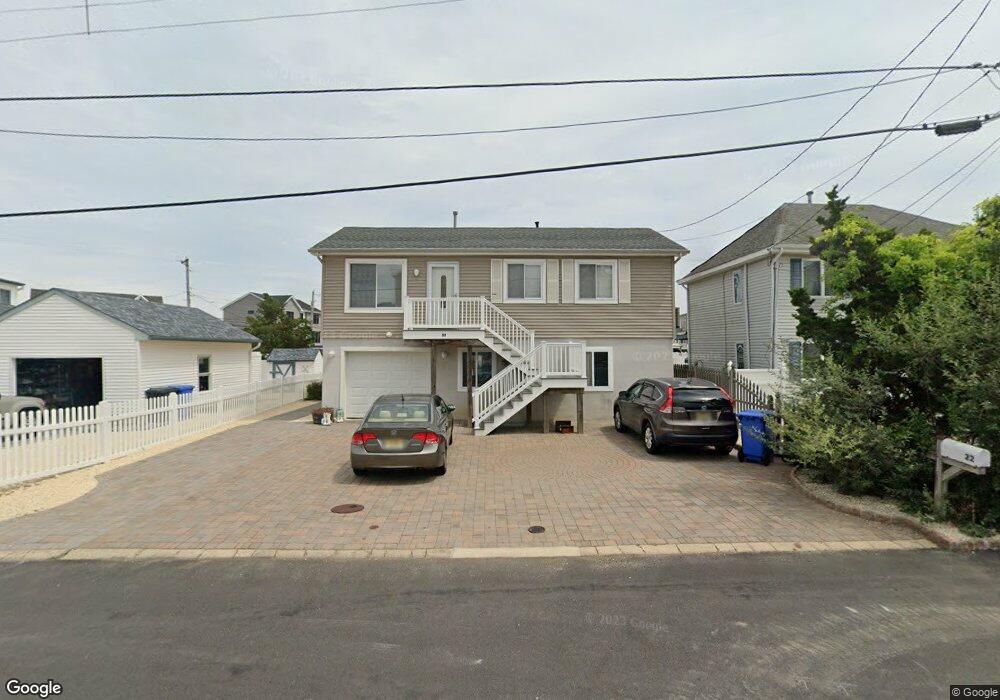
22 Joshua Dr Manahawkin, NJ 08050
Stafford NeighborhoodEstimated Value: $563,000 - $728,000
3
Beds
1
Bath
962
Sq Ft
$689/Sq Ft
Est. Value
About This Home
This home is located at 22 Joshua Dr, Manahawkin, NJ 08050 and is currently estimated at $663,161, approximately $689 per square foot. 22 Joshua Dr is a home located in Ocean County with nearby schools including Oxycocus Elementary School, Ocean Acres Elementary School, and McKinley Avenue Elementary School.
Ownership History
Date
Name
Owned For
Owner Type
Purchase Details
Closed on
Jun 4, 2018
Sold by
Charlotte Sampietro Llc
Bought by
Sampietro Charlotte
Current Estimated Value
Home Financials for this Owner
Home Financials are based on the most recent Mortgage that was taken out on this home.
Original Mortgage
$230,000
Outstanding Balance
$199,357
Interest Rate
4.6%
Mortgage Type
New Conventional
Estimated Equity
$463,804
Purchase Details
Closed on
May 16, 2017
Sold by
Sampietro Charlotte
Bought by
Charlotte Sampietro Llc
Purchase Details
Closed on
Feb 25, 2004
Sold by
Sampietro Eugene and Sampietro Charlotte
Bought by
Sampietro Charlotte
Purchase Details
Closed on
Jan 9, 2003
Sold by
Ferraro Sue
Bought by
Sampietro Eugene and Sampietro Charlotte
Home Financials for this Owner
Home Financials are based on the most recent Mortgage that was taken out on this home.
Original Mortgage
$121,500
Interest Rate
5.98%
Create a Home Valuation Report for This Property
The Home Valuation Report is an in-depth analysis detailing your home's value as well as a comparison with similar homes in the area
Home Values in the Area
Average Home Value in this Area
Purchase History
| Date | Buyer | Sale Price | Title Company |
|---|---|---|---|
| Sampietro Charlotte | -- | None Available | |
| Charlotte Sampietro Llc | -- | -- | |
| Sampietro Charlotte | -- | None Available | |
| Sampietro Eugene | $135,000 | -- |
Source: Public Records
Mortgage History
| Date | Status | Borrower | Loan Amount |
|---|---|---|---|
| Open | Sampietro Charlotte | $230,000 | |
| Previous Owner | Sampietro Eugene | $121,500 |
Source: Public Records
Tax History Compared to Growth
Tax History
| Year | Tax Paid | Tax Assessment Tax Assessment Total Assessment is a certain percentage of the fair market value that is determined by local assessors to be the total taxable value of land and additions on the property. | Land | Improvement |
|---|---|---|---|---|
| 2025 | $6,684 | $269,200 | $162,200 | $107,000 |
| 2024 | $6,620 | $269,200 | $162,200 | $107,000 |
| 2023 | $6,337 | $269,200 | $162,200 | $107,000 |
| 2022 | $6,337 | $269,200 | $162,200 | $107,000 |
| 2021 | $6,251 | $269,200 | $162,200 | $107,000 |
| 2020 | $6,259 | $269,200 | $162,200 | $107,000 |
| 2019 | $6,170 | $269,200 | $162,200 | $107,000 |
| 2018 | $6,132 | $269,200 | $162,200 | $107,000 |
| 2017 | $4,595 | $195,300 | $142,400 | $52,900 |
| 2016 | $4,549 | $195,300 | $142,400 | $52,900 |
| 2015 | $4,874 | $216,900 | $142,400 | $74,500 |
| 2014 | $4,816 | $211,700 | $139,900 | $71,800 |
Source: Public Records
Map
Nearby Homes