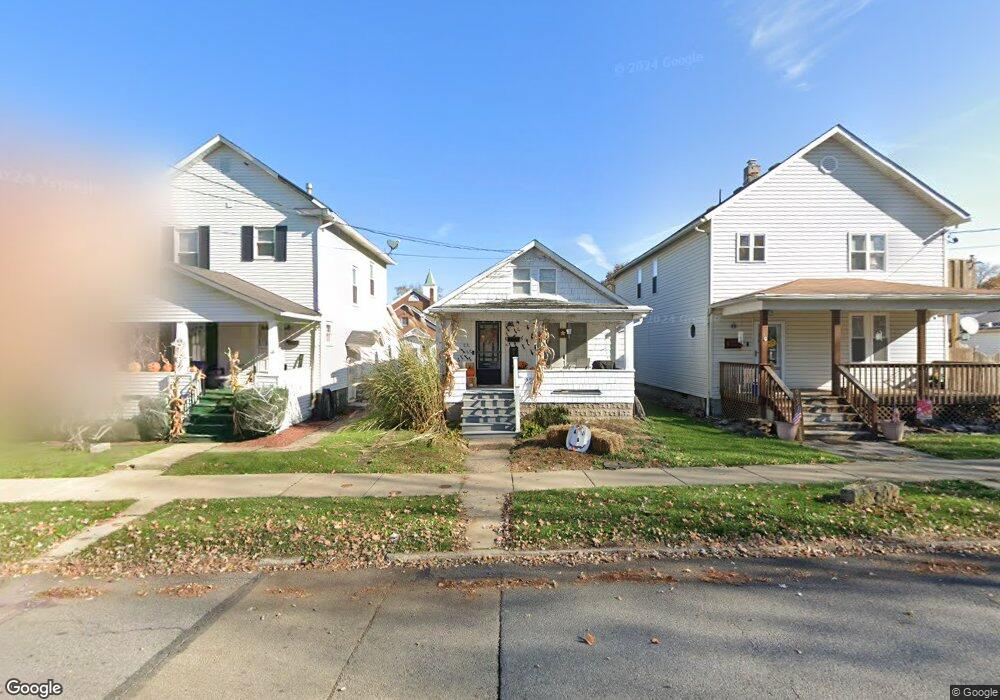
22 Juniper St Homer City, PA 15748
Estimated Value: $104,000 - $268,307
2
Beds
1
Bath
1,066
Sq Ft
$169/Sq Ft
Est. Value
About This Home
This home is located at 22 Juniper St, Homer City, PA 15748 and is currently estimated at $180,077, approximately $168 per square foot. 22 Juniper St is a home located in Indiana County with nearby schools including Homer-Center Elementary School and Homer-Center Junior/Senior High School.
Ownership History
Date
Name
Owned For
Owner Type
Purchase Details
Closed on
Dec 1, 2021
Sold by
Ng Stokes Properties Llc
Bought by
Byt Pack Investments Llc
Current Estimated Value
Home Financials for this Owner
Home Financials are based on the most recent Mortgage that was taken out on this home.
Original Mortgage
$176,000
Outstanding Balance
$161,830
Interest Rate
3.09%
Mortgage Type
Future Advance Clause Open End Mortgage
Estimated Equity
$18,247
Purchase Details
Closed on
Jul 17, 2019
Sold by
Yancy Chad R and Yancy Katie R
Bought by
Ng Stokes Properties Llc
Home Financials for this Owner
Home Financials are based on the most recent Mortgage that was taken out on this home.
Original Mortgage
$51,325
Interest Rate
3.82%
Mortgage Type
Commercial
Purchase Details
Closed on
Dec 2, 2010
Sold by
Yancy Kate A
Bought by
S & T Bank
Create a Home Valuation Report for This Property
The Home Valuation Report is an in-depth analysis detailing your home's value as well as a comparison with similar homes in the area
Home Values in the Area
Average Home Value in this Area
Purchase History
| Date | Buyer | Sale Price | Title Company |
|---|---|---|---|
| Byt Pack Investments Llc | $220,000 | None Available | |
| Ng Stokes Properties Llc | $50,000 | None Available | |
| S & T Bank | $2,675 | None Available |
Source: Public Records
Mortgage History
| Date | Status | Borrower | Loan Amount |
|---|---|---|---|
| Open | Byt Pack Investments Llc | $176,000 | |
| Previous Owner | Ng Stokes Properties Llc | $51,325 |
Source: Public Records
Tax History Compared to Growth
Tax History
| Year | Tax Paid | Tax Assessment Tax Assessment Total Assessment is a certain percentage of the fair market value that is determined by local assessors to be the total taxable value of land and additions on the property. | Land | Improvement |
|---|---|---|---|---|
| 2025 | $1,665 | $59,200 | $11,500 | $47,700 |
| 2024 | $1,641 | $59,200 | $11,500 | $47,700 |
| 2023 | $1,554 | $59,200 | $11,500 | $47,700 |
| 2022 | $1,485 | $59,200 | $11,500 | $47,700 |
| 2021 | $1,485 | $59,200 | $11,500 | $47,700 |
| 2020 | $1,458 | $59,200 | $11,500 | $47,700 |
| 2018 | $1,450 | $59,200 | $11,500 | $47,700 |
| 2017 | $1,457 | $59,200 | $11,500 | $47,700 |
| 2016 | -- | $59,200 | $11,500 | $47,700 |
| 2015 | -- | $7,300 | $750 | $6,550 |
| 2014 | -- | $7,300 | $750 | $6,550 |
Source: Public Records
Map
Nearby Homes