Estimated Value: $171,705 - $221,000
Studio
--
Bath
1,227
Sq Ft
$153/Sq Ft
Est. Value
About This Home
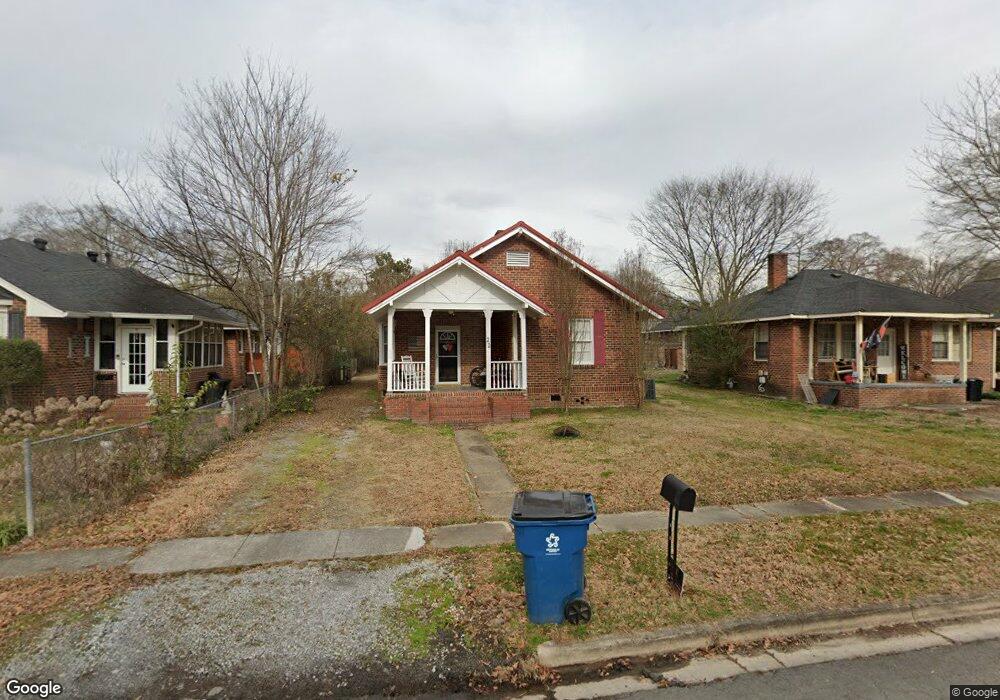
This home is located at 22 Juniper St NE, Rome, GA 30161 and is currently estimated at $187,676, approximately $152 per square foot. 22 Juniper St NE is a home located in Floyd County with nearby schools including Model Middle School, Model High School, and Unity Christian School.
Ownership History
Date
Name
Owned For
Owner Type
Purchase Details
Closed on
Jun 20, 2013
Sold by
Boswell David
Bought by
Hkj Properties Llc
Current Estimated Value
Purchase Details
Closed on
Mar 5, 2013
Sold by
Vannest Justin P
Bought by
Mossy Ridge Real Estate Llc and Boswell David Estate
Purchase Details
Closed on
Oct 2, 2007
Sold by
Not Provided
Bought by
Vannest Justin P
Purchase Details
Closed on
Aug 17, 2006
Sold by
Not Provided
Bought by
Vannest Justin P
Purchase Details
Closed on
Jul 7, 2006
Sold by
Not Provided
Bought by
Vannest Justin P
Purchase Details
Closed on
Mar 27, 2006
Sold by
Not Provided
Bought by
Vannest Justin P
Purchase Details
Closed on
Jan 17, 2005
Sold by
Evans Alane Sharpe
Bought by
Mcguire Lynn W
Purchase Details
Closed on
Apr 13, 1994
Sold by
Blackwell Lavelle H
Bought by
Sharpe Alane
Purchase Details
Closed on
Jan 1, 1979
Sold by
Hester Clarence H
Bought by
Blackwell Lavelle H
Purchase Details
Closed on
Jan 1, 1901
Bought by
Hester Clarence H
Create a Home Valuation Report for This Property
The Home Valuation Report is an in-depth analysis detailing your home's value as well as a comparison with similar homes in the area
Home Values in the Area
Average Home Value in this Area
Purchase History
| Date | Buyer | Sale Price | Title Company |
|---|---|---|---|
| Hkj Properties Llc | -- | -- | |
| Mossy Ridge Real Estate Llc | $35,956 | -- | |
| Vannest Justin P | -- | -- | |
| Vannest Justin P | $88,000 | -- | |
| Vannest Justin P | $112,000 | -- | |
| Vannest Justin P | $62,000 | -- | |
| Mcguire Lynn W | $30,000 | -- | |
| Sharpe Alane | -- | -- | |
| Blackwell Lavelle H | -- | -- | |
| Hester Clarence H | -- | -- |
Source: Public Records
Tax History
| Year | Tax Paid | Tax Assessment Tax Assessment Total Assessment is a certain percentage of the fair market value that is determined by local assessors to be the total taxable value of land and additions on the property. | Land | Improvement |
|---|---|---|---|---|
| 2025 | $1,495 | $51,040 | $7,304 | $43,736 |
| 2024 | $1,495 | $51,040 | $9,453 | $41,587 |
| 2023 | $1,274 | $31,489 | $6,339 | $25,150 |
| 2022 | $968 | $31,489 | $6,339 | $25,150 |
| 2021 | $840 | $31,488 | $6,945 | $24,543 |
| 2020 | $893 | $28,341 | $5,305 | $23,036 |
| 2019 | $811 | $26,037 | $5,305 | $20,732 |
| 2018 | $767 | $24,587 | $5,305 | $19,282 |
| 2017 | $743 | $23,721 | $5,305 | $18,416 |
| 2016 | $757 | $23,880 | $5,800 | $18,080 |
| 2015 | $1,072 | $25,272 | $2,480 | $22,792 |
| 2014 | $1,072 | $24,632 | $2,480 | $22,152 |
Source: Public Records
Map
Nearby Homes
- 61 Ash St NE
- 27 Oak St NE
- 14 Green St NE
- 44 Dogwood St NE
- 46 Dogwood St NE
- 3 Hickory St NE
- 1 Fir St NE
- 7 Ash St NE
- 0 Cypress St NE Unit 10699266
- 0 Cypress St NE Unit 7725685
- 0 Euclid Ave Unit 10617853
- 3 Joplin St NE
- 2 N Pointe Dr NE
- 2681 N Broad Street Extension NE
- 2682 N Broad Street Extension NE
- 2009 N Broad St NE
- 0 Veterans Memorial Hwy NE Unit 10503178
- 0 Veterans Memorial Hwy NE Unit 10666330
- 0 Veterans Memorial Hwy NE Unit 9418044
- 2201 Southern St NE
- 24 Juniper St NE
- 20 Juniper St NE
- 26 Juniper St NE
- 5 Kirkwood St NE
- 18 Juniper St NE
- 3 Kirkwood St NE
- 7 Kirkwood St NE
- 5 Juniper St NE
- 7 Juniper St NE Unit 126
- 7 Juniper St NE
- 3 Juniper St NE
- 28 Juniper St NE
- 9 Kirkwood St NE
- 1 Kirkwood St NE
- 1 Juniper St NE
- 11 Kirkwood St NE
- 30 Juniper St NE
- 3 Norwood St NE
- 5 Norwood St NE
- 58 Ash St NE
Your Personal Tour Guide
Ask me questions while you tour the home.