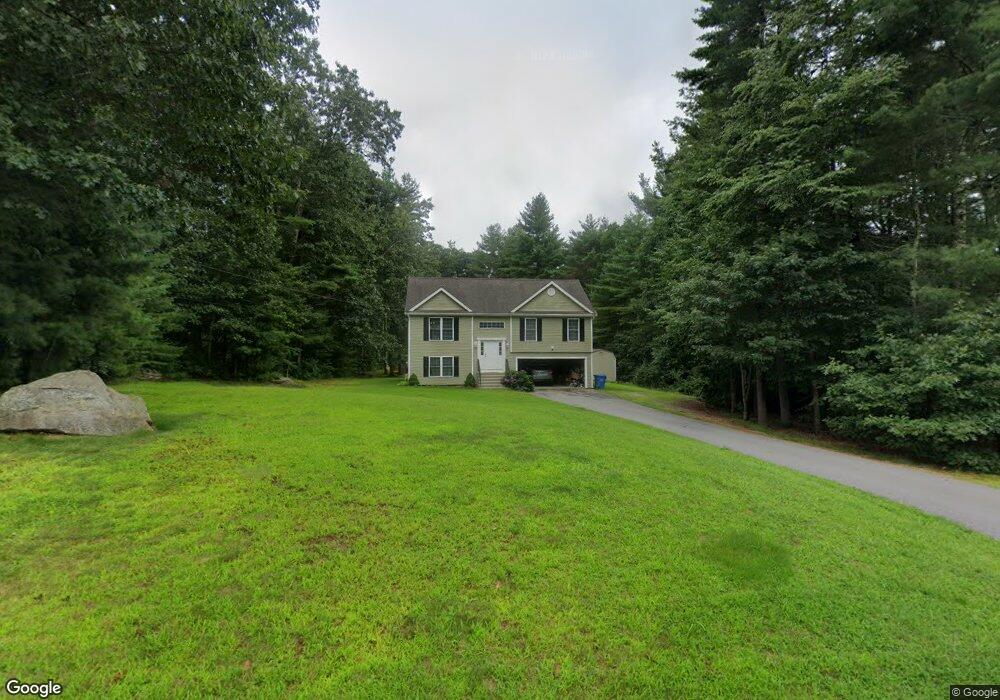
22 Juniper Way Brooklyn, CT 06234
Brooklyn NeighborhoodEstimated Value: $429,536 - $502,000
3
Beds
2
Baths
1,176
Sq Ft
$396/Sq Ft
Est. Value
About This Home
This home is located at 22 Juniper Way, Brooklyn, CT 06234 and is currently estimated at $466,134, approximately $396 per square foot. 22 Juniper Way is a home with nearby schools including Brooklyn Elementary School, Brooklyn Middle School, and St. James Parochial School.
Ownership History
Date
Name
Owned For
Owner Type
Purchase Details
Closed on
Nov 4, 2015
Sold by
Emond Cheryl A
Bought by
Solis Jessica A
Current Estimated Value
Home Financials for this Owner
Home Financials are based on the most recent Mortgage that was taken out on this home.
Original Mortgage
$177,600
Outstanding Balance
$140,117
Interest Rate
3.88%
Estimated Equity
$326,017
Purchase Details
Closed on
Jun 5, 2013
Sold by
Juniper Hills Inv Llc
Bought by
Emond Cheryl A
Home Financials for this Owner
Home Financials are based on the most recent Mortgage that was taken out on this home.
Original Mortgage
$220,899
Interest Rate
3.43%
Mortgage Type
New Conventional
Create a Home Valuation Report for This Property
The Home Valuation Report is an in-depth analysis detailing your home's value as well as a comparison with similar homes in the area
Home Values in the Area
Average Home Value in this Area
Purchase History
| Date | Buyer | Sale Price | Title Company |
|---|---|---|---|
| Solis Jessica A | $222,000 | -- | |
| Solis Jessica A | $222,000 | -- | |
| Emond Cheryl A | $225,000 | -- | |
| Emond Cheryl A | $225,000 | -- |
Source: Public Records
Mortgage History
| Date | Status | Borrower | Loan Amount |
|---|---|---|---|
| Open | Emond Cheryl A | $177,600 | |
| Closed | Emond Cheryl A | $177,600 | |
| Previous Owner | Emond Cheryl A | $220,899 |
Source: Public Records
Tax History Compared to Growth
Tax History
| Year | Tax Paid | Tax Assessment Tax Assessment Total Assessment is a certain percentage of the fair market value that is determined by local assessors to be the total taxable value of land and additions on the property. | Land | Improvement |
|---|---|---|---|---|
| 2025 | $6,932 | $297,760 | $40,490 | $257,270 |
| 2024 | $5,131 | $173,700 | $29,400 | $144,300 |
| 2023 | $4,968 | $173,700 | $29,400 | $144,300 |
| 2022 | $4,773 | $173,700 | $29,400 | $144,300 |
| 2021 | $4,589 | $173,700 | $29,400 | $144,300 |
| 2020 | $4,300 | $148,700 | $34,600 | $114,100 |
| 2019 | $4,300 | $148,700 | $34,600 | $114,100 |
| 2018 | $4,177 | $148,700 | $34,600 | $114,100 |
| 2017 | $4,028 | $148,700 | $34,600 | $114,100 |
| 2016 | $3,864 | $146,700 | $34,600 | $112,100 |
| 2015 | $3,660 | $156,200 | $41,900 | $114,300 |
| 2014 | $3,660 | $156,200 | $41,900 | $114,300 |
Source: Public Records
Map
Nearby Homes
- 147 South St
- 72 South St
- 14 South St
- 68 Allen Hill Rd
- 405 Providence Rd
- 80 Ventura Dr
- 423 Providence Rd
- 454 Providence Rd
- 0 Allen Hill Rd Unit 24140370
- 53 Carol Ave
- 54 Ventura Dr
- 53 Ventura Dr
- 478 Wauregan Rd
- 53 S Main St
- 24 Ventura Dr
- 332 Providence Rd
- 51 Westview Dr
- 0 Providence Rd Unit 24080985
- 405 South St
- 35 S Main St